...
| Widget Connector | ||
|---|---|---|
|
Step-by-step
Load the file containing the volume into the DataVis perspective, check both the file and the dataset to plot. By default, datasets with more than two dimensions are plotted as images.
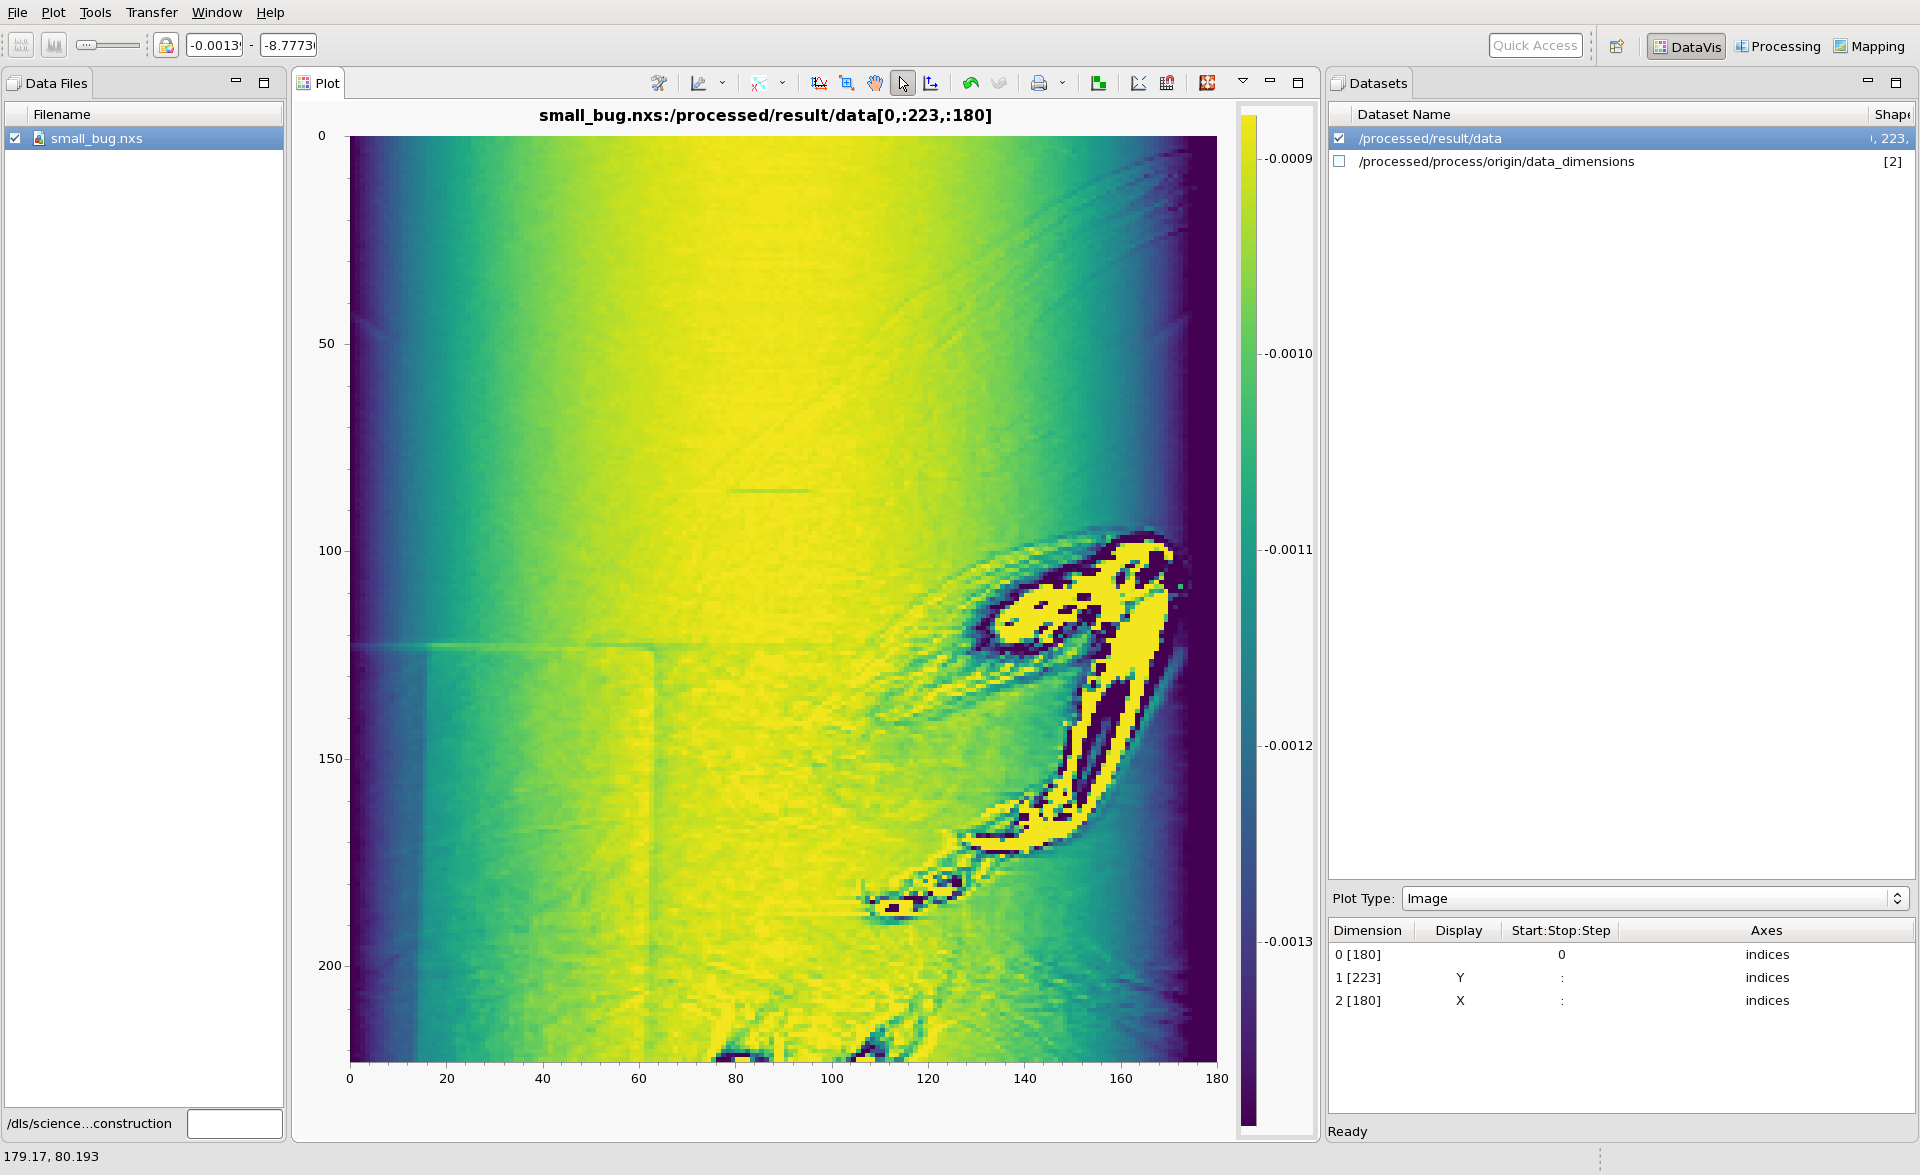
The table at the bottom of the dataset view can be used to change what part of the volume is displayed as an image.
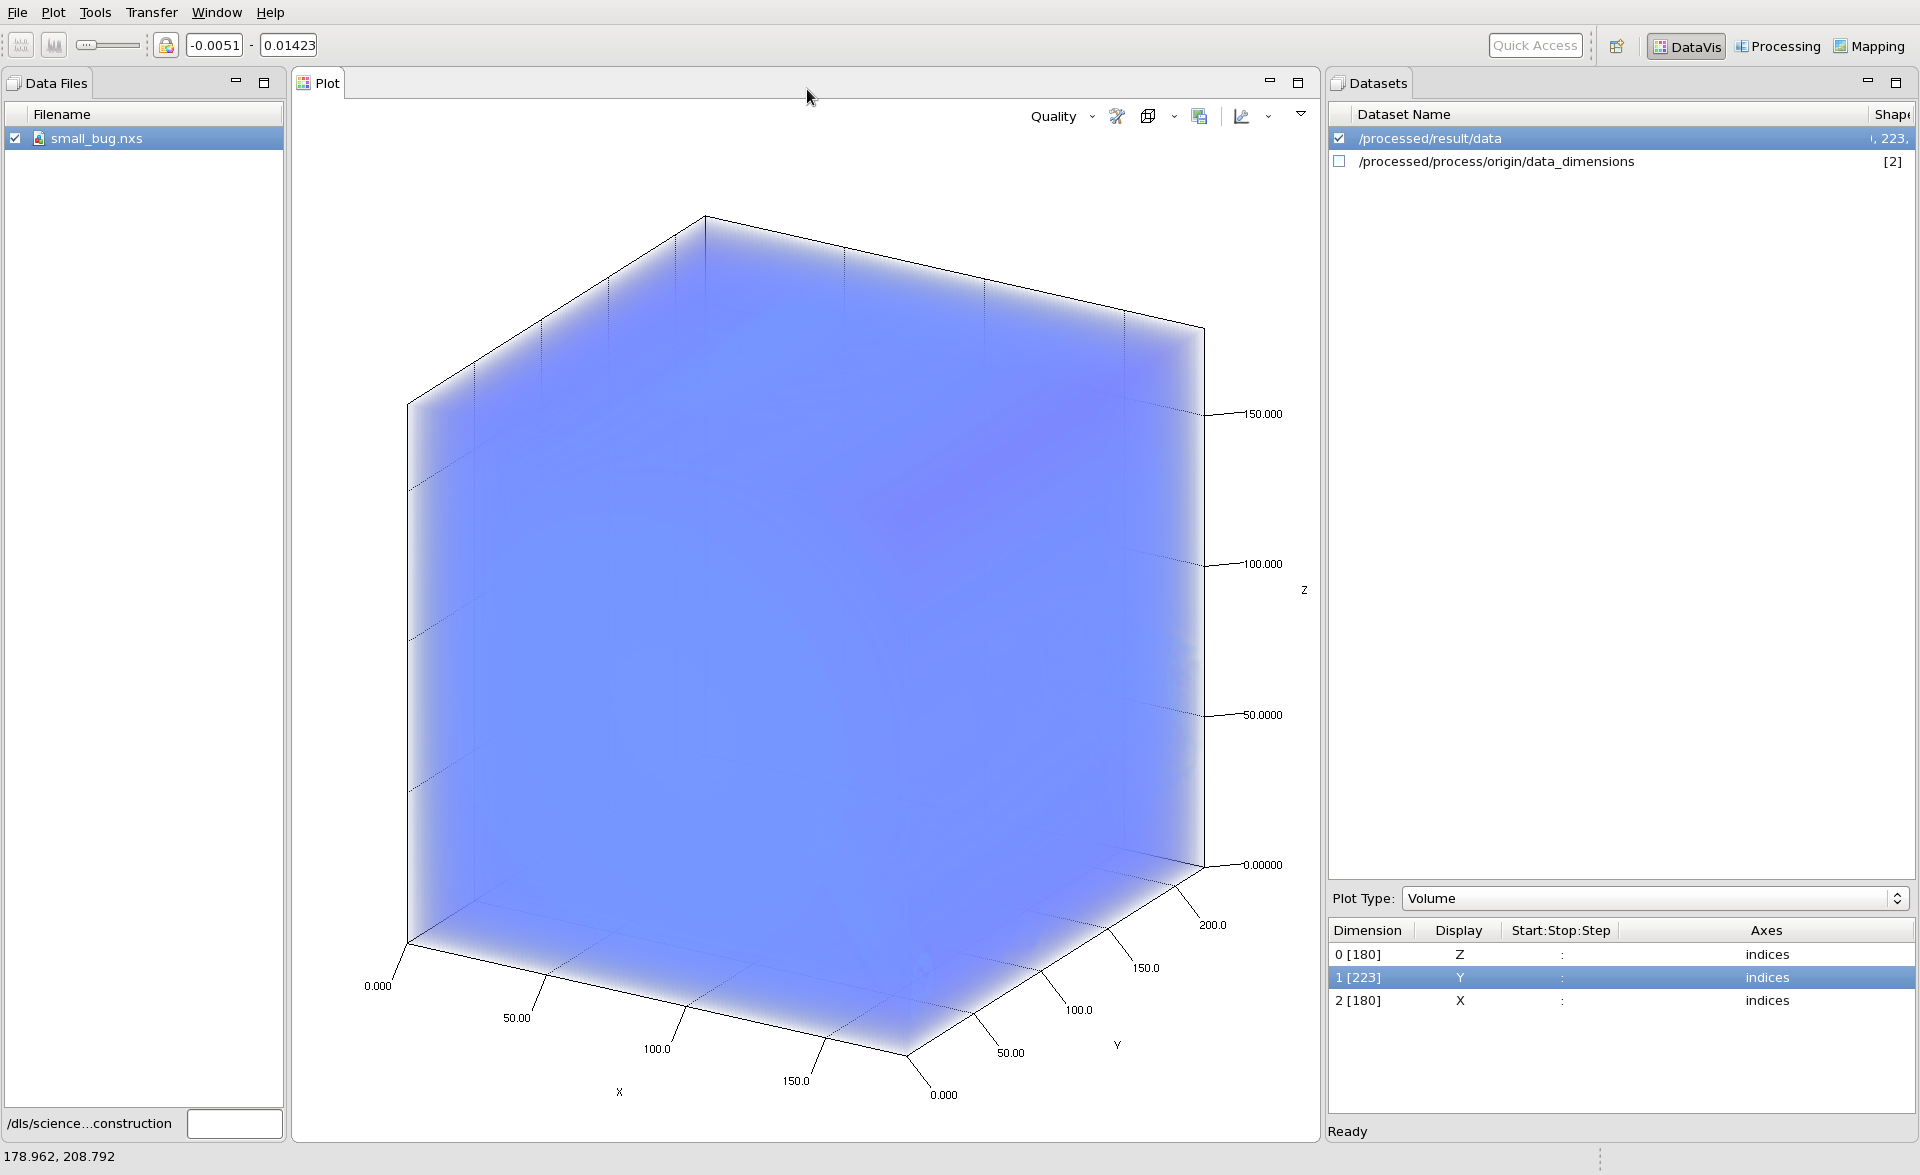
To render the data as a volume, select Volume from the Plot Type: drop down box. The selected volume will be rendered with default parameters.
To get the volume to show something useful, the min and max color map values need to be changed. Using the Plot view toolbar, select the Histogram tool.
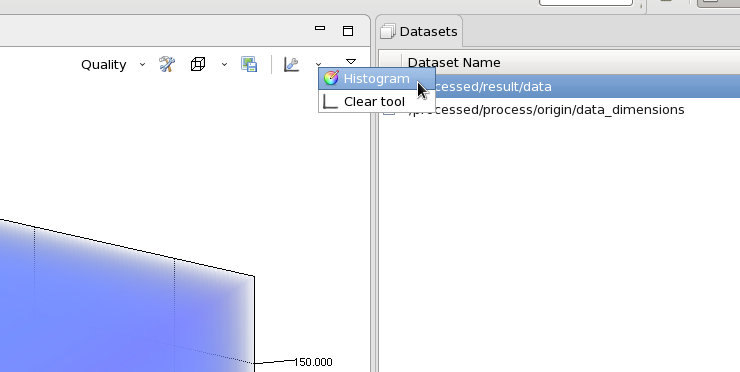
The Histogram tool shows a plot of the histogram of the data values with a blue box that shows the minimum and maximum values used for the colormapping.