...
In this guide we are going to demonstrate the methods available in the DataVis perspective to visualise reconstructed tomography volumes. The step-by-step walkthrough is done using a downsampled reconstruction of the insect head data found here.
The data file used in this example can be downloaded from here https://alfred.diamond.ac.uk/DawnExampleData/small_bug.nxs
Volume Rendering
Quick Video Guide
...
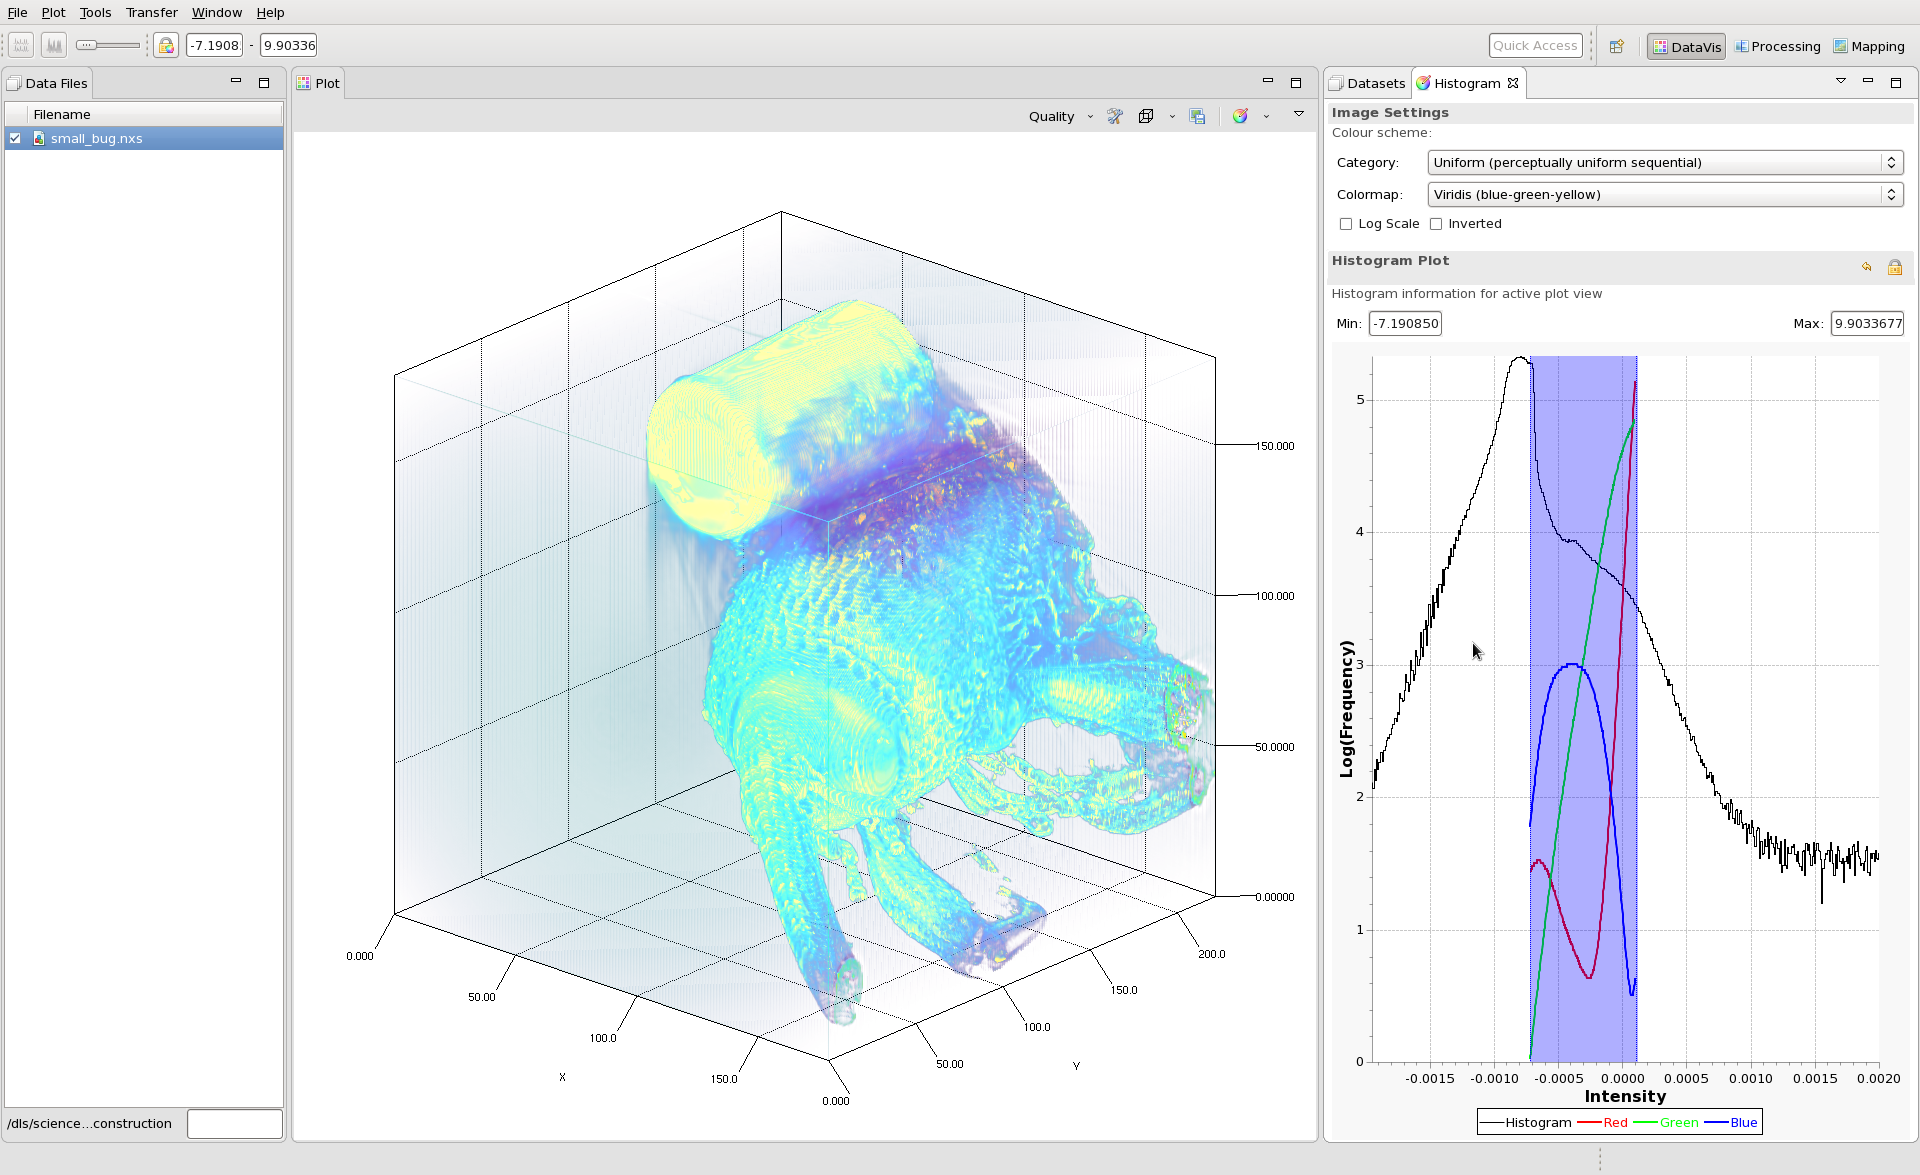
The Histogram tool shows a plot of the histogram of the data values with a blue box that shows the minimum and maximum values used for the colormappingthe color mapping. The min/max values can be changed by dragging the blue region or changing the values in the min and max text fields.
Once the color mapping is set, the image can be saved as a png using the button on the plot toolbar.