...
| Widget Connector | ||
|---|---|---|
|
Lets get started...
From an open DAWN, the easiest way to access DataVis is by typing DataVis in the Quick Access box and pressing Enter.
...
One of the aims of the DataVis perspective is to have a clean, simple user interface. At the moment, DataVis doesn't use the Project Explorer or File Navigator found in other perspectives.
Loading Data
To load data into the DataVis perspective either use the File, Open File... menu, or drag and drop a file into the Data Files View.
...
How the image looks will be very much dependent on the default colormap and histogram settings (histogram setting can be adjusted using the Quick Histogram Widget.
Viewing and Slicing Data
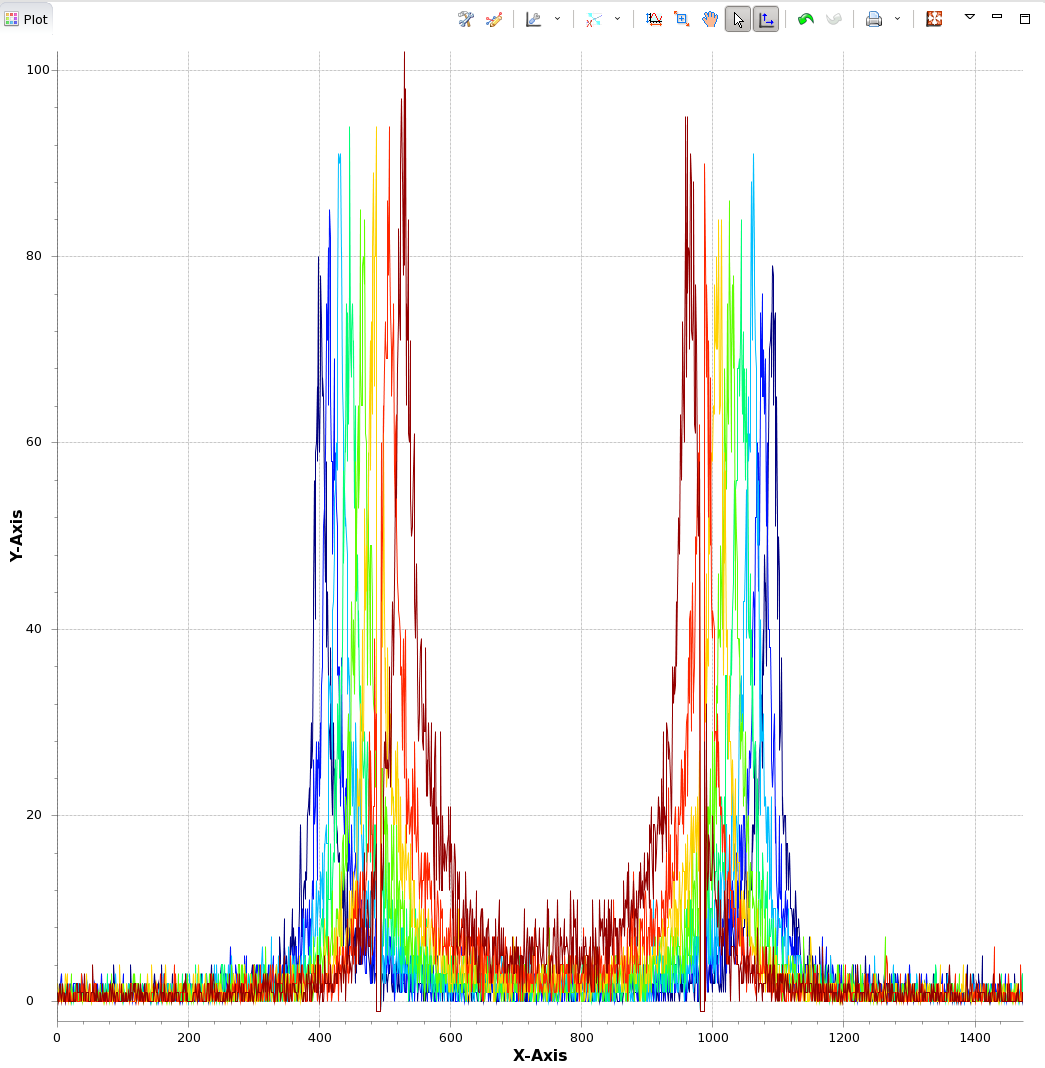
Now lets assume that this data is better viewed as a series of lines rather than an image.
...
The colour of the lines can be changed using Plot/Line Plot Colours and selecting the colour map to apply to the sequence.
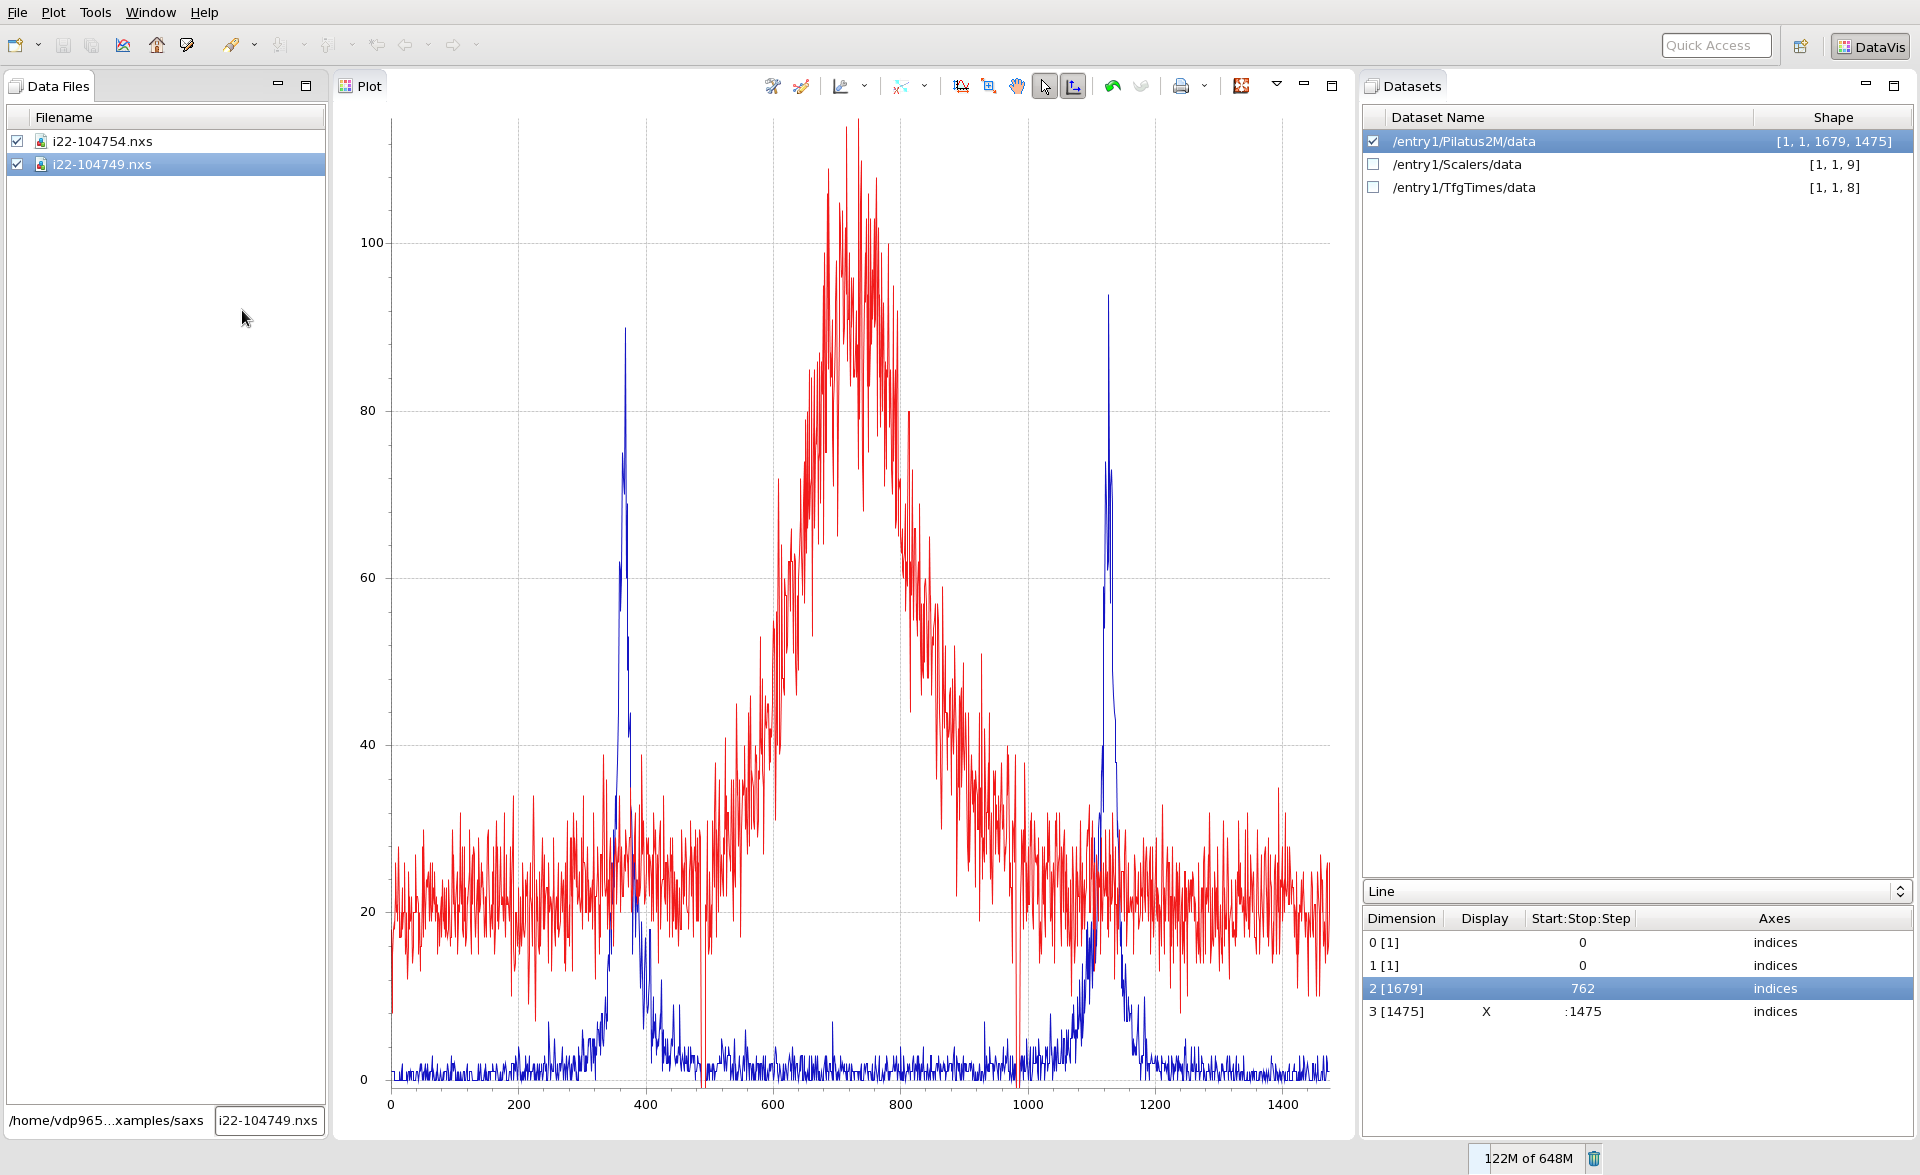
Comparing Data From Multiple Files
DataVis was designed with comparing data in mind. Say you have loaded the Pilatus image above, sliced it as a line, and found one of the channels doesn't look right, and you want to compare it to the same channel in a different image.
...
Checking the box next to the newly loaded file should now plot the same channel from the two files over the top of each other.
Data With Axes
It is more common that not that data only makes sense when plotted against a set of axes. The images we have looked at so far have no axes, so lets load some new data and see how DataVis works with axes.
...