...
As time goes by, we'll also add more tutorials to cover some of the more specialised Perpectivesperpectives. This tutoral covers the Data Browsing perspective.
...
1) Browsing Data
The goal of the first in this series of training sheets is to use the two generic data viewing perspectives (Data Browsing and DExplore) to visualize different types of data (images, surfaces, tracesdata browsing capabilities of DAWN are provided by two modules which take slightly different approaches to the same problem: Data Browsing (the default perspective) and DExplore. Both are capable of opening a range of different data types (traces, images, surface...) from many different types of files (dat, tif, img, Nexus/hdf5, tiff, img....) and become comfortable with using and changing the versatile interface DAWN provides.
- Click on the icon for the Data Browsing perspective
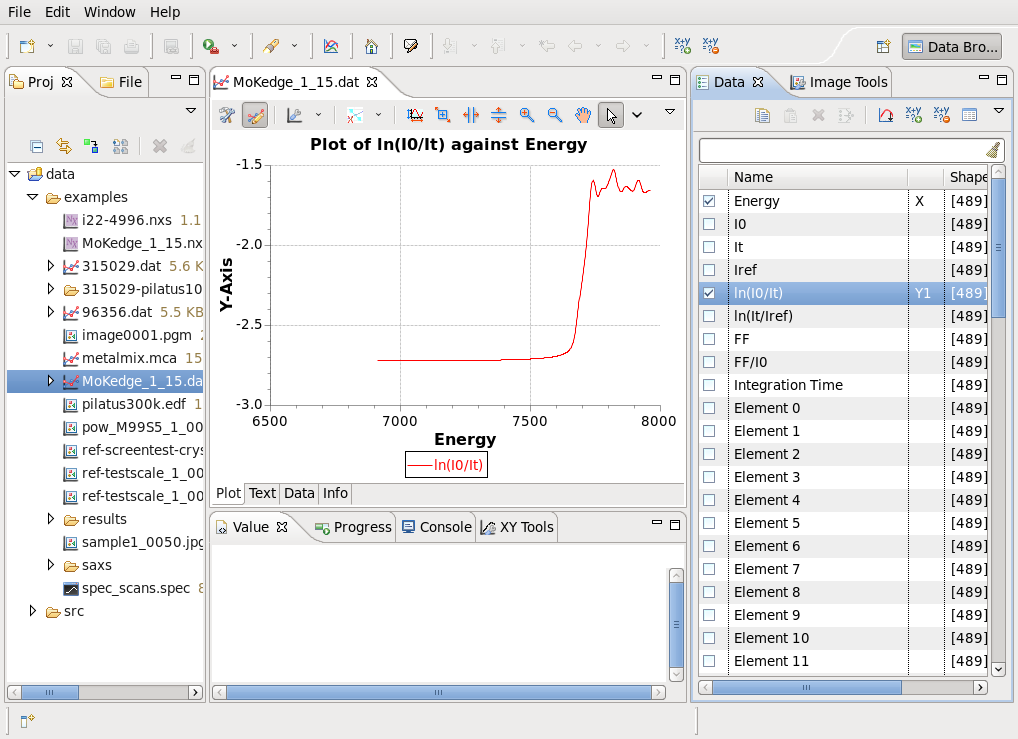
 ....). In the First Steps section you already plotted a trace, but now we'll look at how you can re-format that plot. Re-draw the plot of Energy vs ln(I0/It from the MoKedge_1_15.dat file:
1) Open DAWN and start the Data Browsing perspective
2) Expand the data folder in the left-most pane of the DAWN window (see the screenshot above)
3) Double click on the file MoKedge_1_15.dat
4) Select the checkboxes in the Data tab on the right next to Energy and ln(I0/It) (select them in that order!)
You should now have a plot displayed in a dat-file editor, similar to the screenshot below:
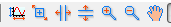
As mentioned in the description of Editors, the tool bar of the plot tab contains a range of useful tools for formatting or analysing the data.
4. The Plot - Basics
- Close all the open editors (can you do this without having to click the cross on each one?) and reopen pow_M99S5_1_0001.cbf
When DAWN opens and image it automatically displays a default plot and automatically adjusts the contrast/brightness of the image. The plot can be customized by using the settings action. 
- Open the settings window, change the title of the plot, adjust the histogram type, how does the image change?
Navigating the plot
The above toolbar actions can be used to zoom and pan around the image.
- Use these actions to zoom in and pan around the image, what does rolling the mouse wheel when the cursor is over the plot do?
Image tool bar actions
- Can you find the action to turn on/off keeping the image aspect ratio? What about to make the image full screen (press esc to return from full screen view)
The view menu - Colormaps
There are more options for adjusting the image in the view menu 
- Find the color section of the view menu and select a different colormap. Play with the histogram type with different color maps to see how they change the way image looks.
Trace tool bar actions
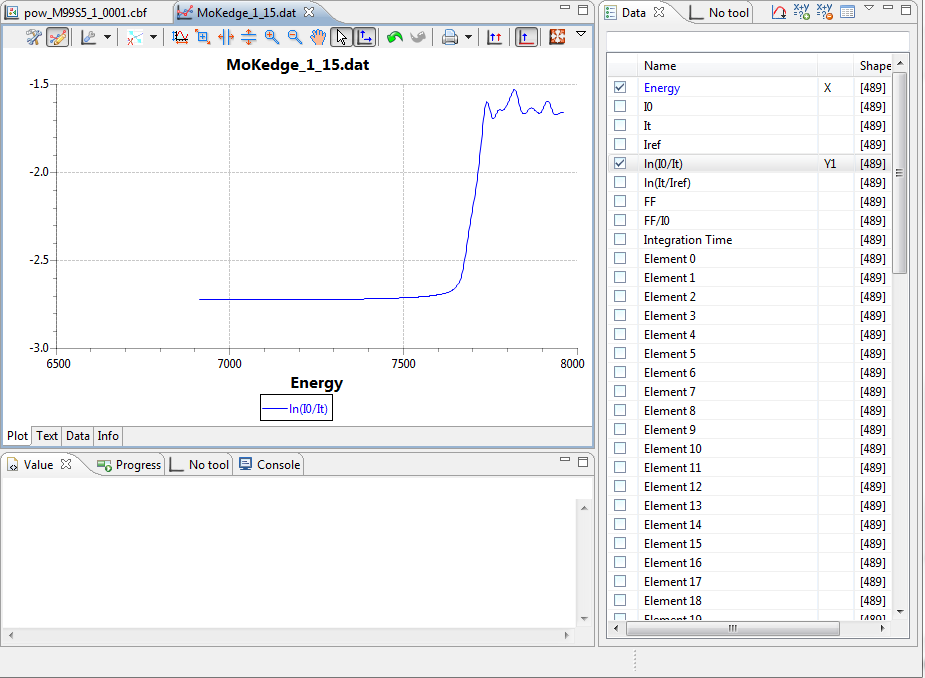
- In the example data, open MoKedge_1_15.dat and plot ln(It/Iref) vs Energy, what do these two plot tool bar actions do
 .
. - How can you perform a similar action by right clicking in the data view?
- Change the trace color from blue to red and the plot title to "My Data".
- Remove, then re-add the legend to the plot.
- Change the y-axis to be log(y).
a. Dat File Editor
Has three tabs for accessing data
- Plot - shows the currently plotted data (empty if no data selected)
- Text - a .dat file is just a text file, this tab shows the raw text of the file
- Data - shows the data which has been selected to plot (or just a warning if no data is selected)
- Info - shows the name, minimum and maximum values and the type of data each data set holds.
- Switch to the plot tab in the Editor then select the Energy and In(i0/it) data sets from the Data view.
You should see a single trace plotted, as shown above.
- What does the data tab in the editor show now?
You will be greeted with a largely blank screen with lots of empty tabs, don't worry about that for now.
...
Take another look at the editor. You should notices some tab pages at the bottom which say Plot, Text, Data and Info. Switch between these tabs to see what they show.
Dat File Editor
- Plot - shows the currently plotted data (empty if no data selected)
- Text - a .dat file is just a text file, this tab shows the raw text of the file
- Data - shows the data which has been selected to plot (or just a warning if no data is selected)
- Info - shows the name, minimum and maximum values and the type of data each data set holds.
- Switch to the plot tab in the Editor then select the Energy and In(i0/it) data sets from the Data view.
You should see a single trace plotted, as shown above.
...
Nexus File Editor
- In the example data, open I22-4996.nxs, what tabs does the editor contain now?
...
If you find you are using a particular set of views in a perspective you can save that arrangement as your own bespoke perspective so it always resets to have your most used views where you expect them.
4. The Plot - Basics
- Close all the open editors (can you do this without having to click the cross on each one?) and reopen pow_M99S5_1_0001.cbf
...