...
The perspectives used in this example will be DataVis - the initial data loading, stacking and defining of the function to be fit, and Processing - to apply the fit down the stack of patterns.
The data used in this example can be downloaded from here https://alfred.diamond.ac.uk/DawnExampleData/xrd_temperature_scan.zip
Step 1 - Loading and Combining the .xy Files
...
To fit this function to the series, the function can be exported to a file, then the Processing perspective can be used to sequentially apply this fit to each pattern. When an function has been defined that optimizes correctly, in the Function Fitting tool toolbar, click the Export function button, and save the function to file.
Step 3 - Fitting the Function To the Series
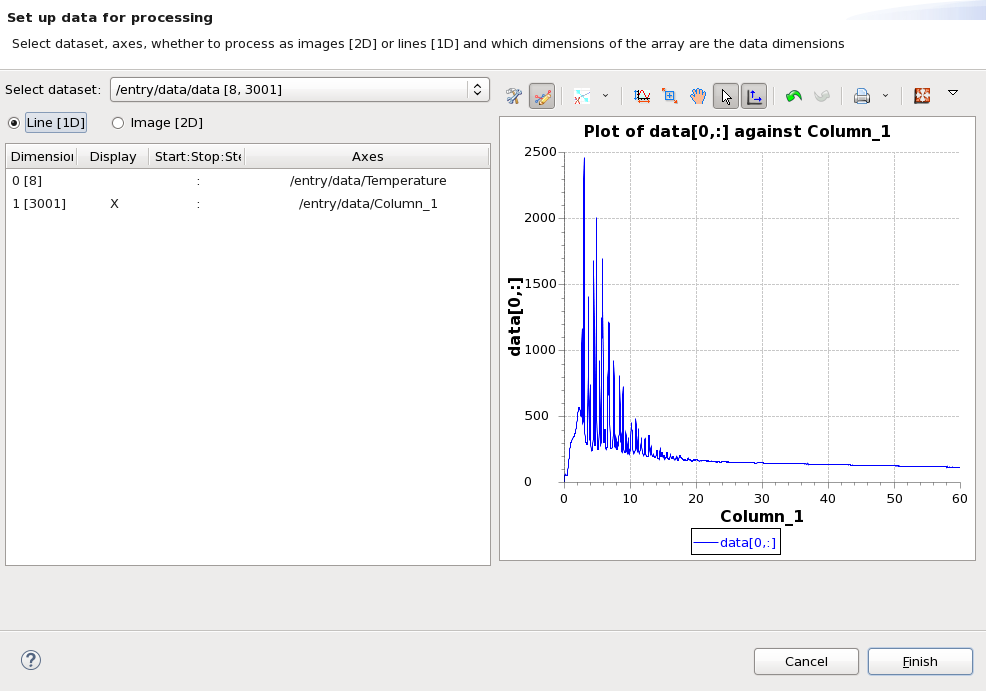
Switch to the Processing Perspective, and load the combined file. In the dialog that appears, select to processing the combined data (/entry/data/data [8,3001]), as a Line (the Column_1 and Temperature axes should be picked up automatically).
Once loaded, the first pattern should be shown in the Input view. Click in the Processing view table and add Fit Imported Function (typing fit should filter out the other processing steps). In the Model view table, click in the Value column next to Function File, and file browser to select the saved function file created earlier. Click back on the Fit Imported Function entry to update it with the new path. When the process runs, the data should be visible in the Output view, with the fitted function and residual traces.
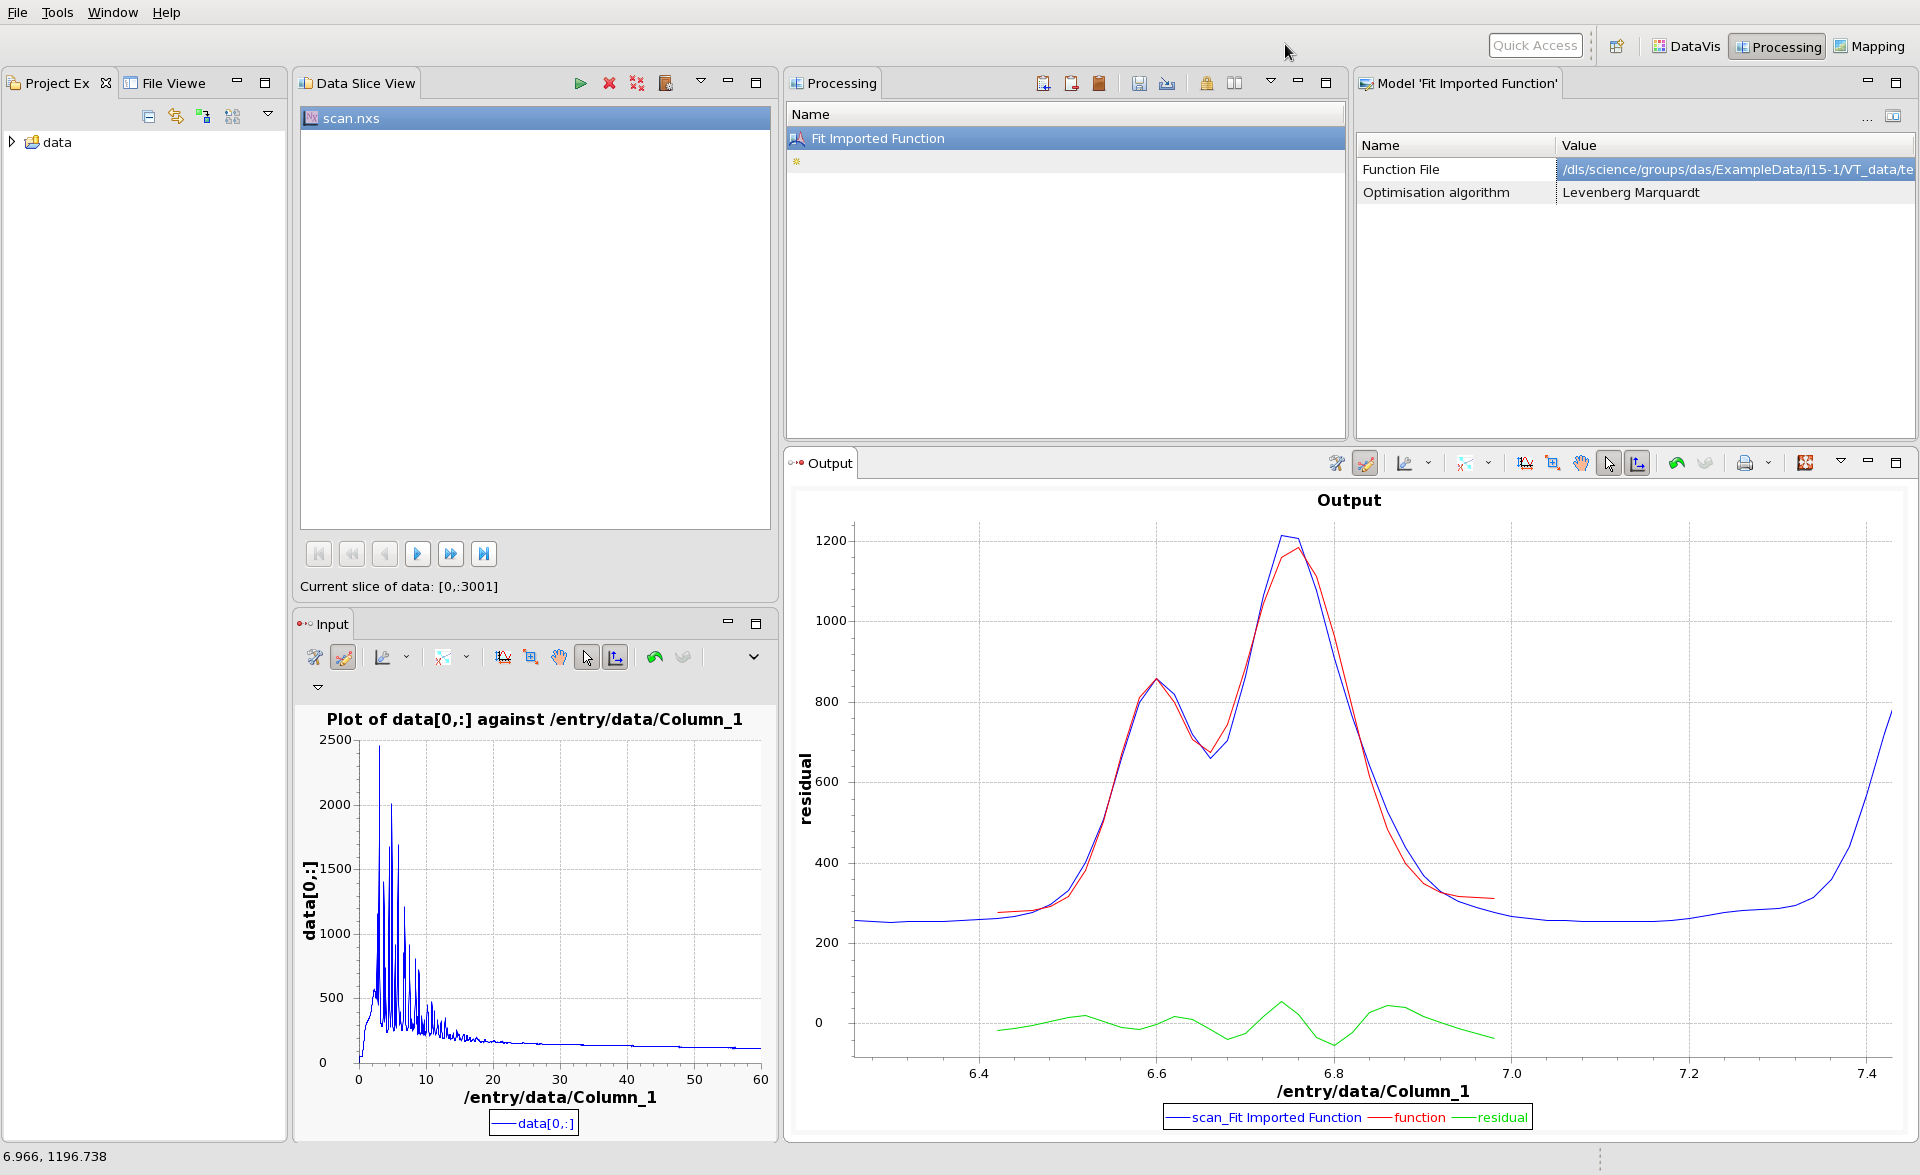
Pressing the green play button at the top of the Data Slice View, will process all the data, saving the output parameters out into a Nexus file.
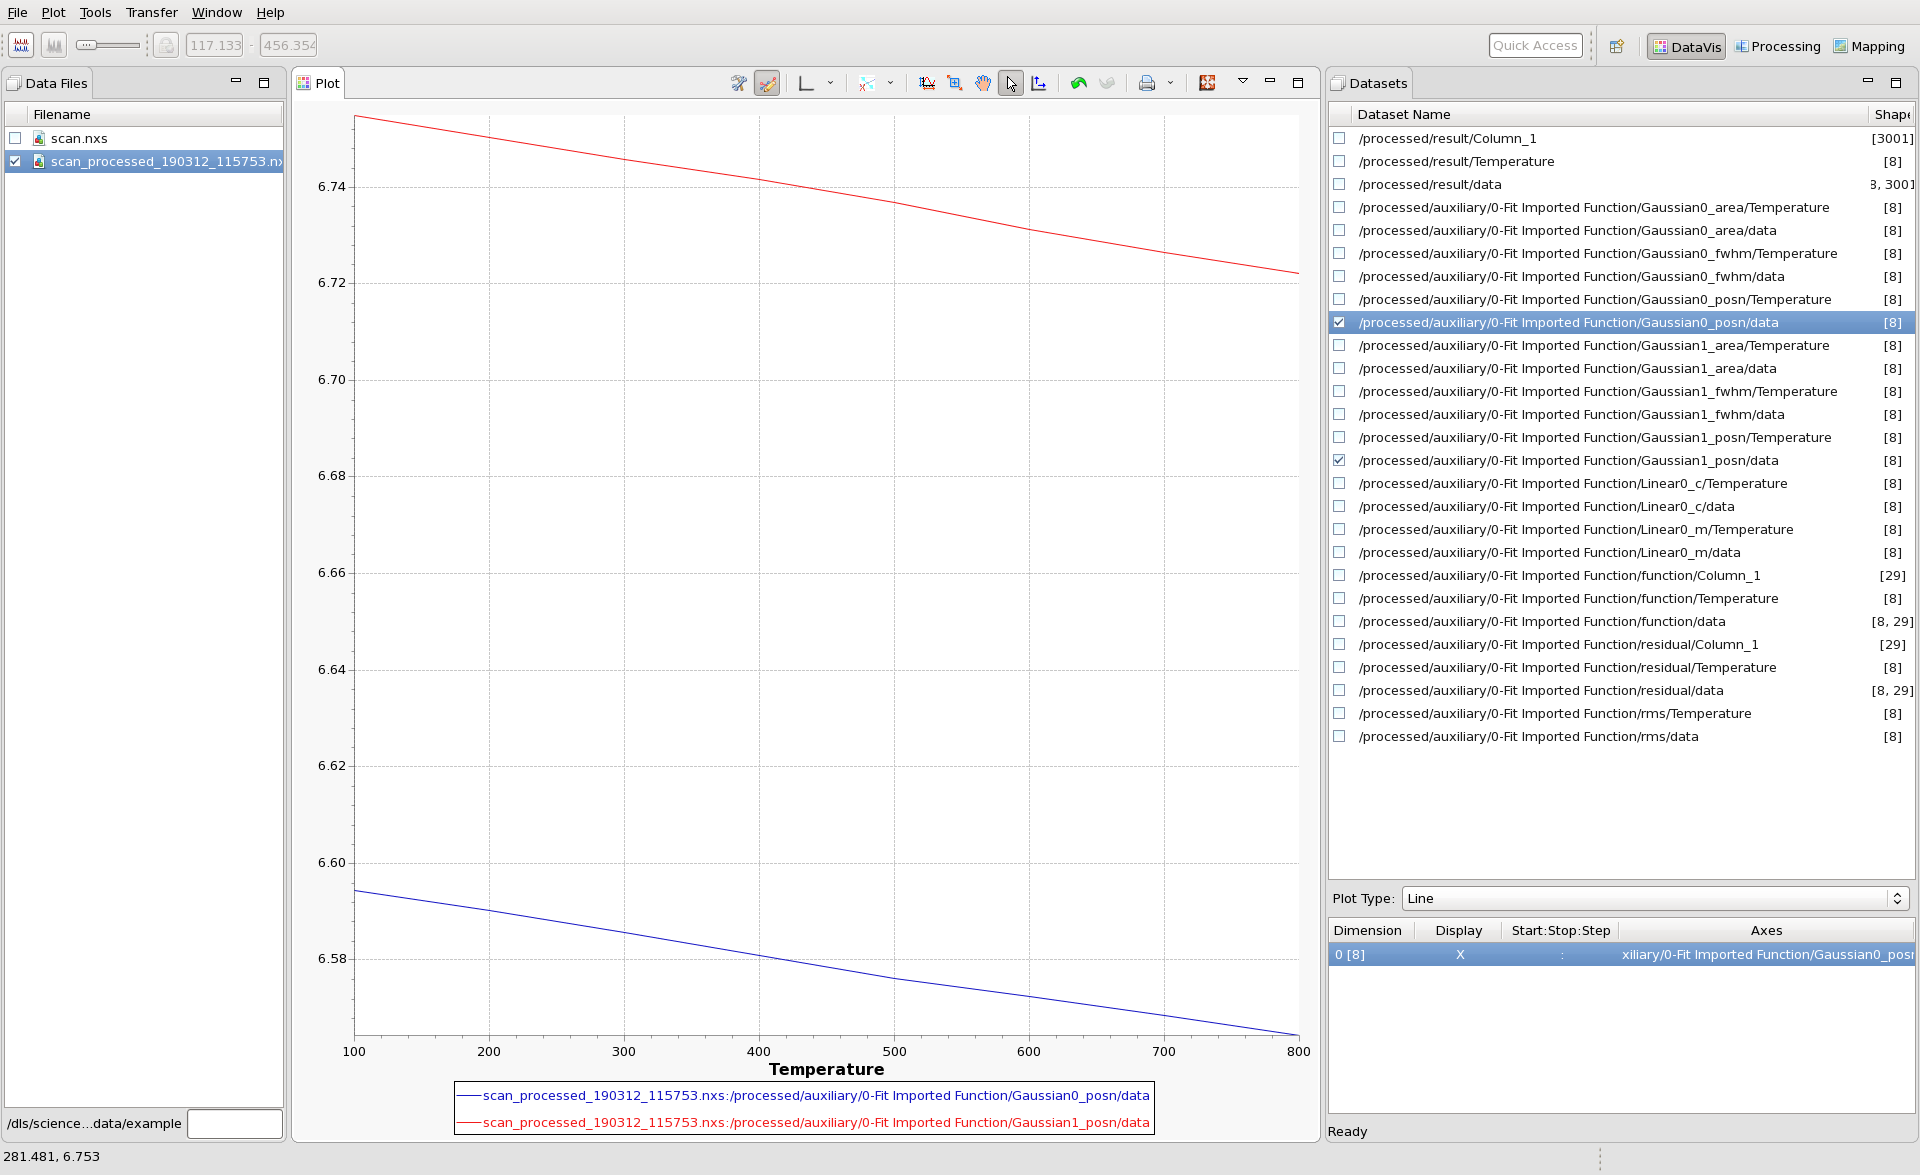
Opening the output Nexus file in DataVis allows the fitted parameters to be plotted as a function of Temperature.