| Table of Contents |
|---|
Introduction
This quick start guide is a rapid tour through the three main generic perspectives in DAWN, DataVis, Mapping and Processing.
...
This file is from a Infrared imaging experiment of a fixed cell sample, and is a nice example since it can be visualised in many different ways.
Lets get started...
If you haven't already, download the example data file from here: https://alfred.diamond.ac.uk/DawnExampleData/ftir1.nxs
...
(DAWN stores its state when you close it down, so if this is not what your DAWN looks like, its possibly because you have started it before. If you want to reset everything and completely start from the beginning follow the instructions at the bottom of the page).
Loading and Viewing Data - DataVis
By default DAWN starts up in the DataVis perspective (for more on perspectives see here #TODO insert link). The main purpose of this perspective is to allow data from multiple files to be viewed in multiple different ways.
In the main File menu, select Open File... and select the NeXus file you have just downloaded. Check the box next to the filename ftir1.nxs to display some data from the file (DataVis uses the tagging in the NeXus file to choose which dataset to show by default). It should look like this.
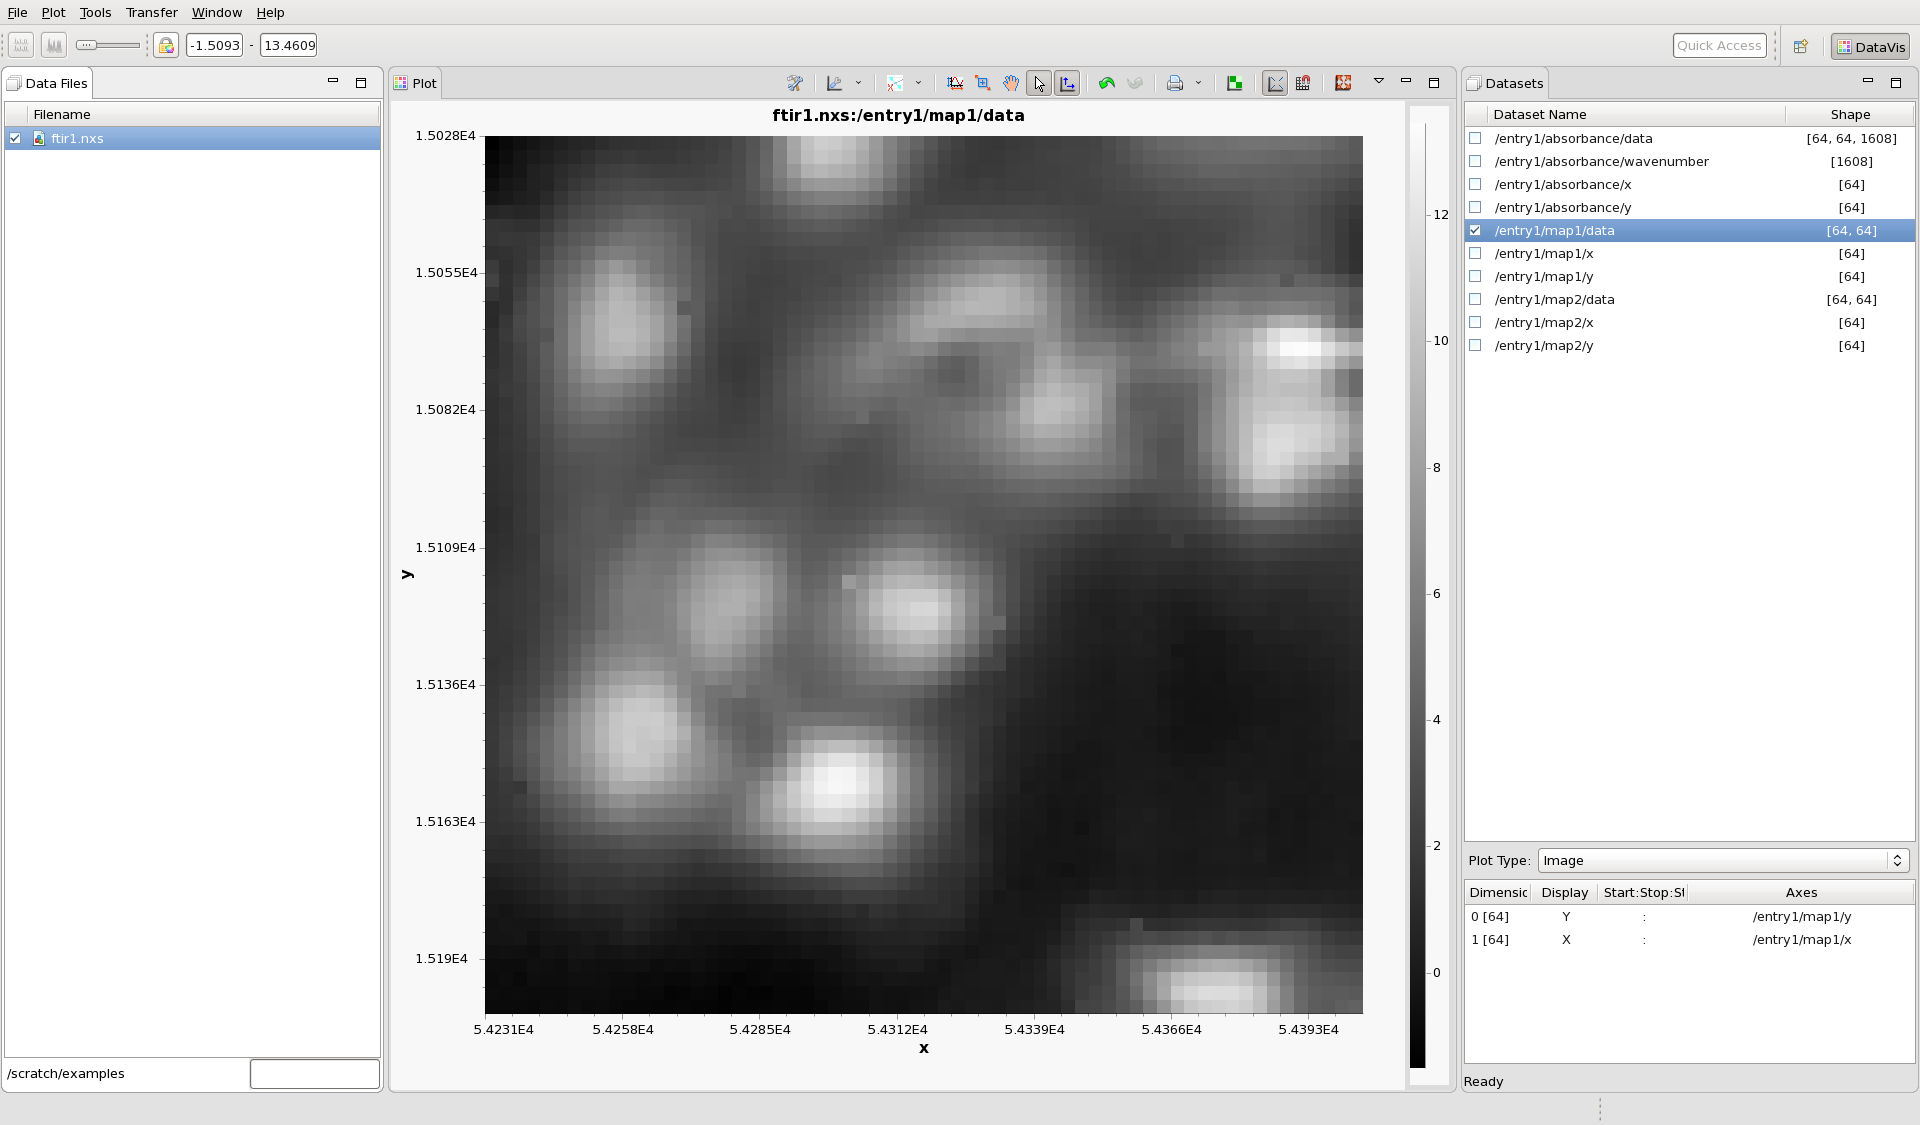
DAWN has selected to plot /entry1/map1/data as an image (it is an infrared image of some cells). Different datasets can be plotted by checking the box next to the name of the dataset in the Datasets view. Check the box next to /entry1/map2/data to see this image (the same cells at a different wavelength).
...
It is also possible to view the data as spectra, by displaying lines, with the 1608 dimension as X, like this:
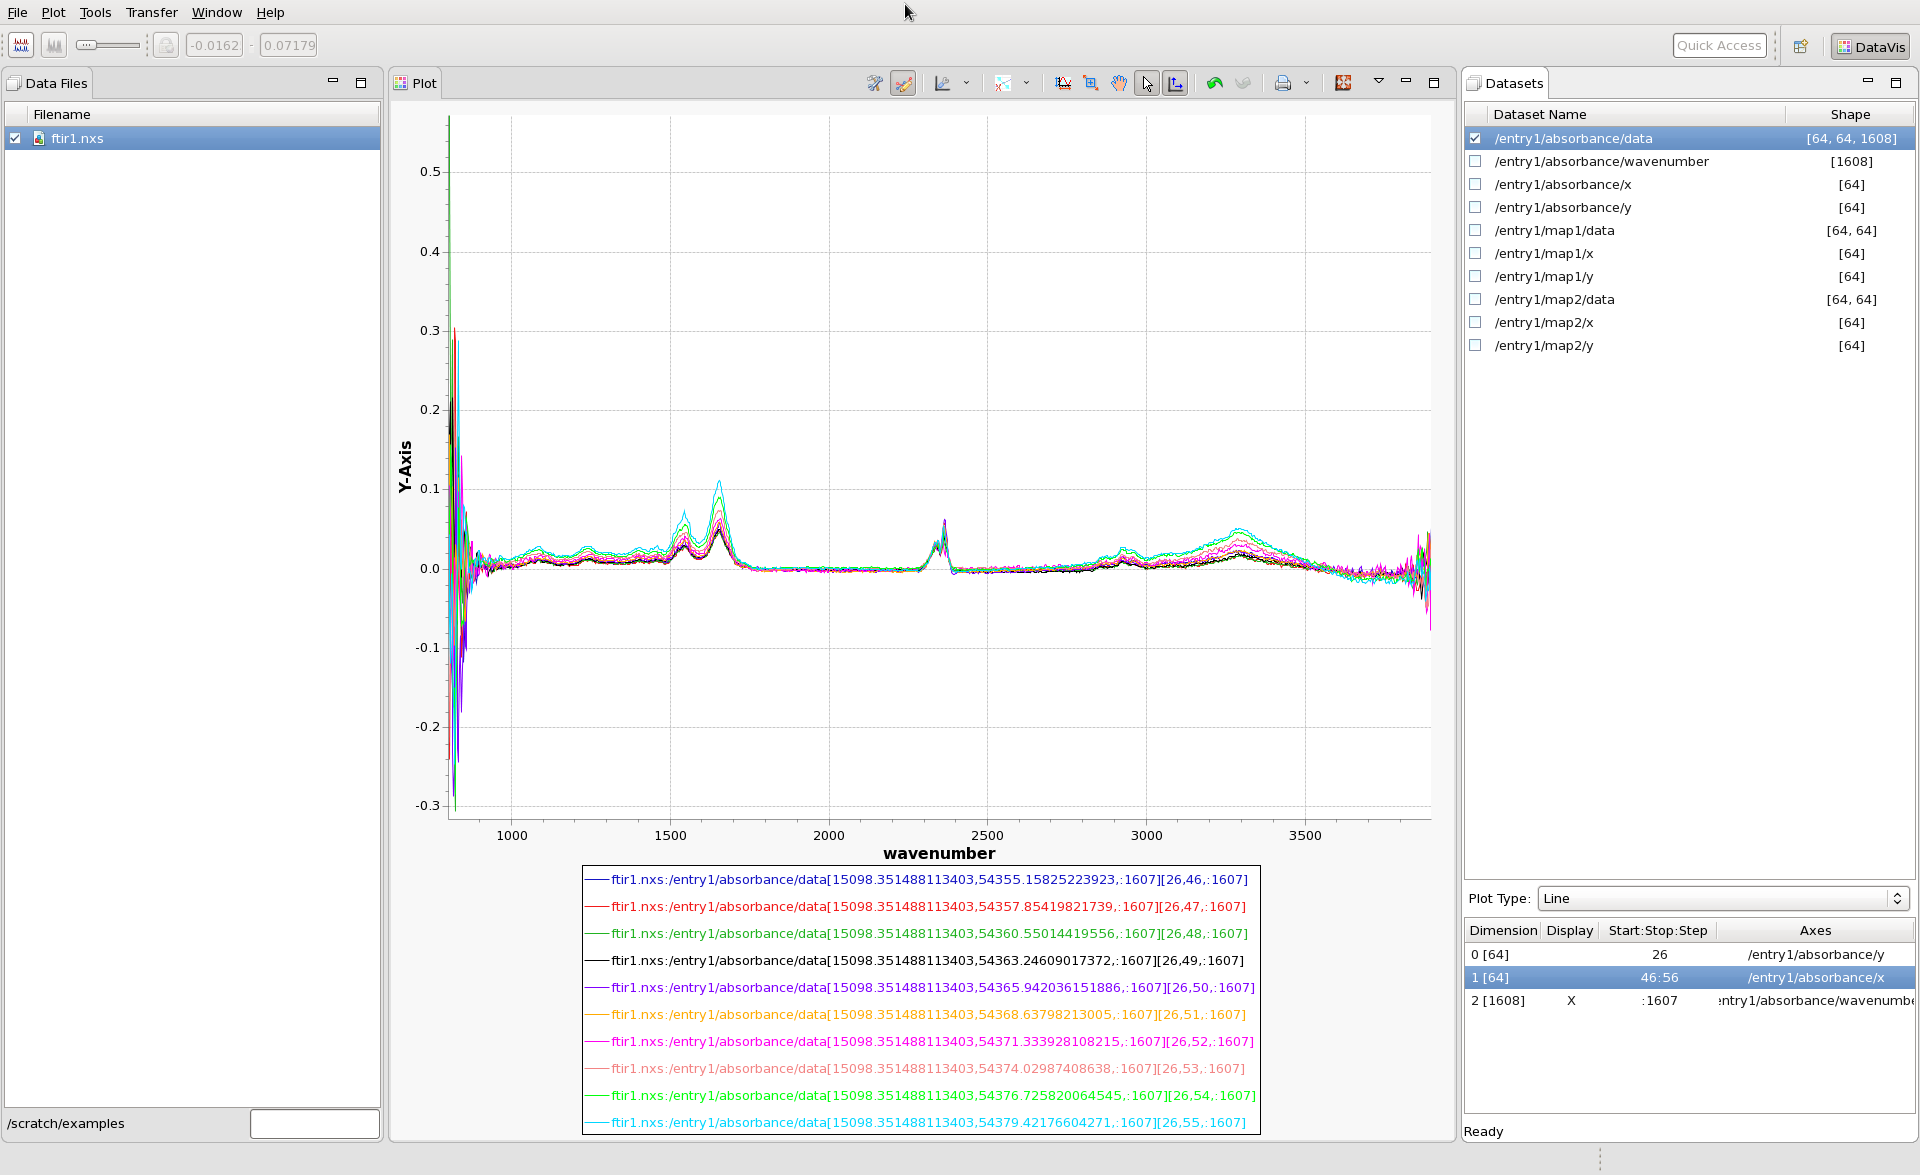
Using this dataset, try some of the other modes in the Plot Type drop down and see what happens. More information on the DataVis perspective can be found here #TODO link.
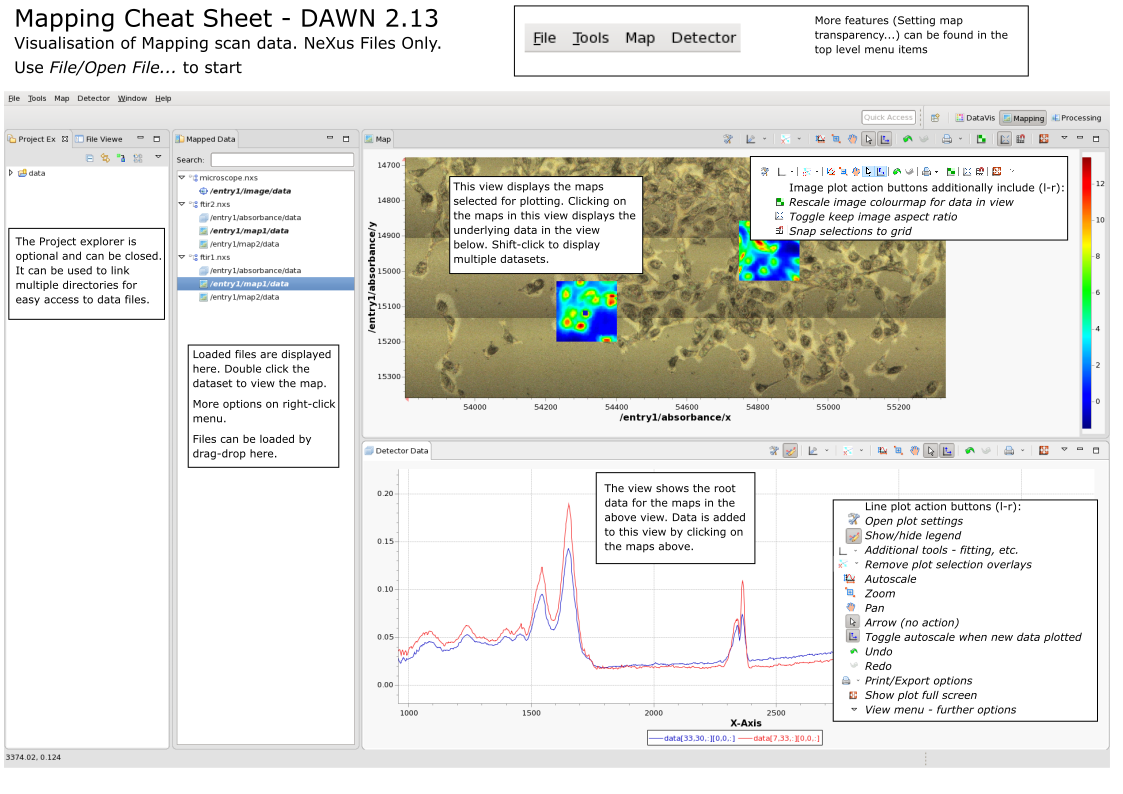
Loading and Viewing Data - Mapping
The data file used in this example contains several datasets composed of values taken at different spatial location in a sample. For data collected like this (a grid scan of an area detector, or array detector for example), and is stored in a NeXus file that meets certain criteria, the Mapping Perspective in DAWN can be used to view this data in a more intuitive way.
...
This is very similar to the slicing of data in the DataVis perspective seen earlier, but is a much more useful and intuitive way to view this kind of data. It is possible to load multiple files into the mapping perspective, allowing data from different files, but measured on the same sample, to be compared directly. More information on how to use the mapping perspective can be found here #TODO add link to mapping perspective guide
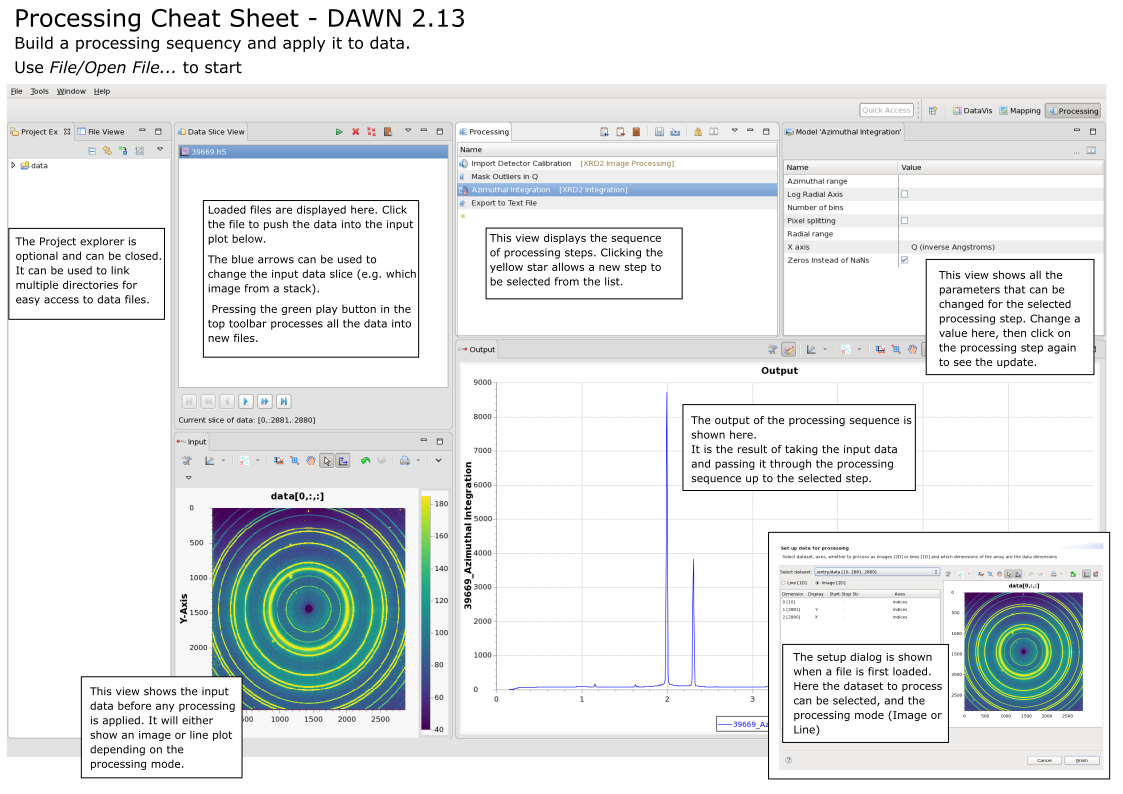
Processing Data - Processing
In the last part of this quick start guide we will consider how to process data. The Processing Perspective in DAWN is designed to take data (either 2D images or 1D spectra/patterns/traces) and pass it through a series of processing steps. These processing steps can then be applied to every image in the stack (or 1D spectrum in a 3D block etc).
...
More information on the Processing Perspective can be found here #TODO link to processing perspective guide.
Cheatsheets
The Cheatsheets are a single page with a brief guide to each perspective.
DataVis
Mapping
Processing
Troubleshooting
#TODO reseting perspectives, reset workspace, deleting workspace.
...