...
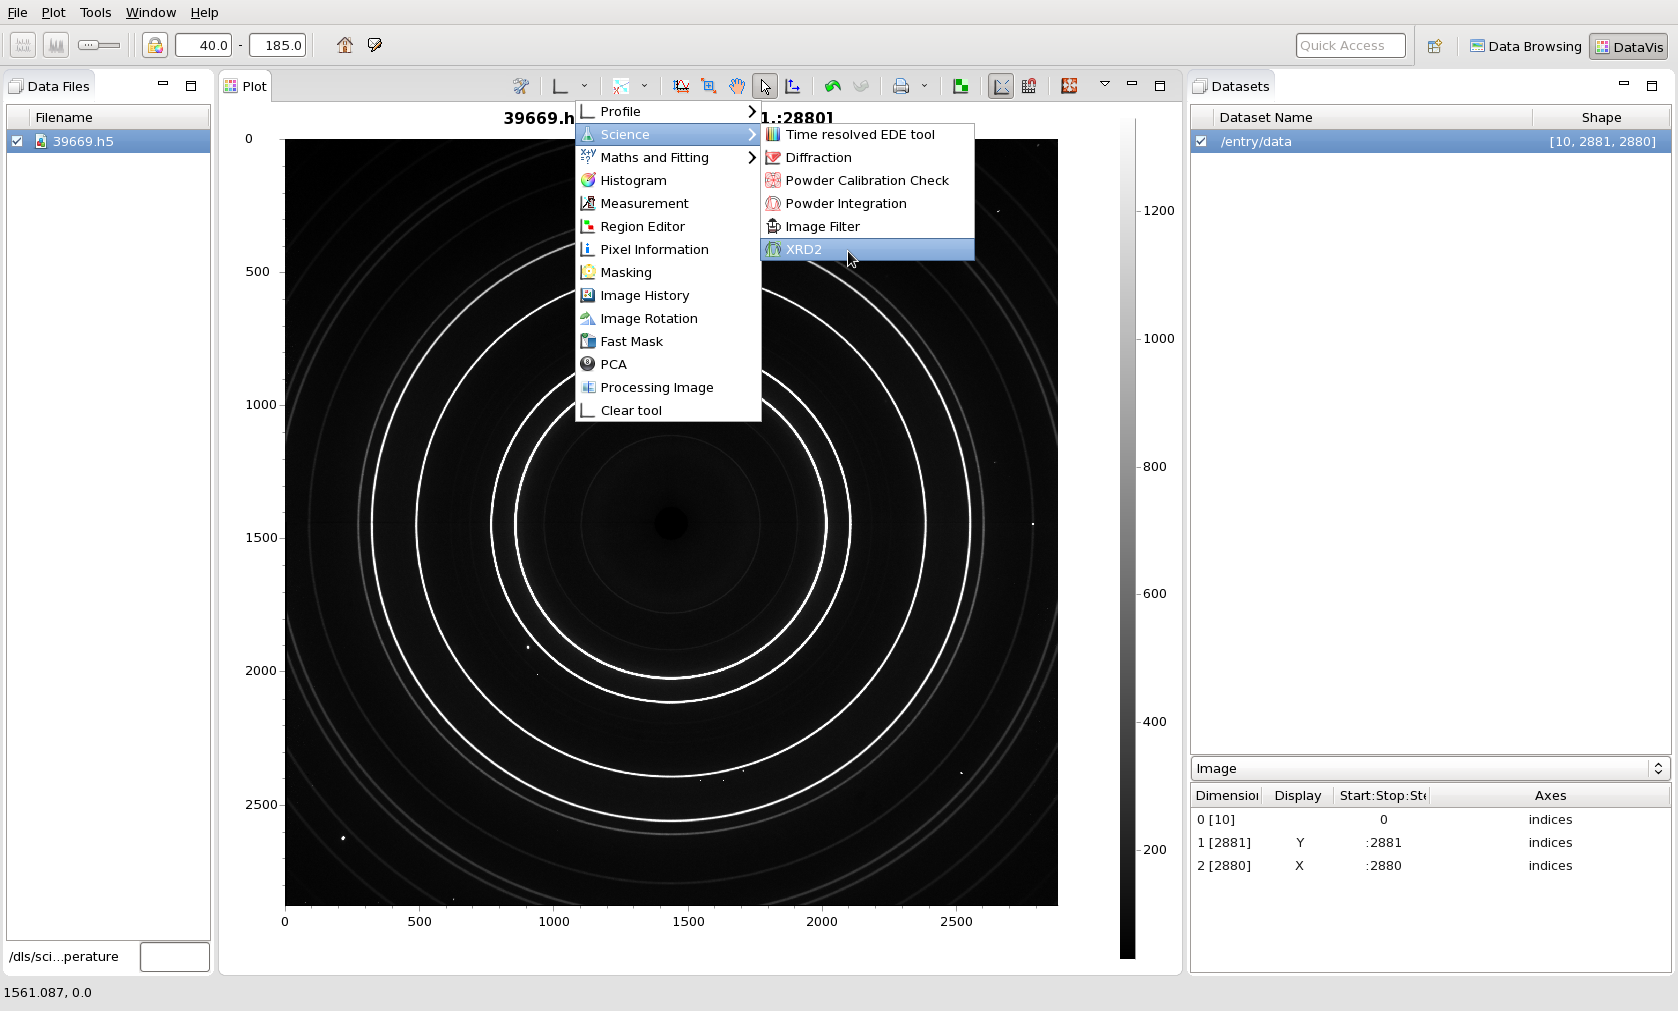
- From the tools menu, select Science/XRD2
- The tool contains three sections, an Options section, a plot and a panel for entering information (calibration/mask files etc)
- The first step is to load a calibration, the can be done by drag-dropping a file into the value column next to Calibration File, or clicking in the cell and using the buttons to open a file navigator
- Once a calibration file is selected, the reduced data will be shown in the plot
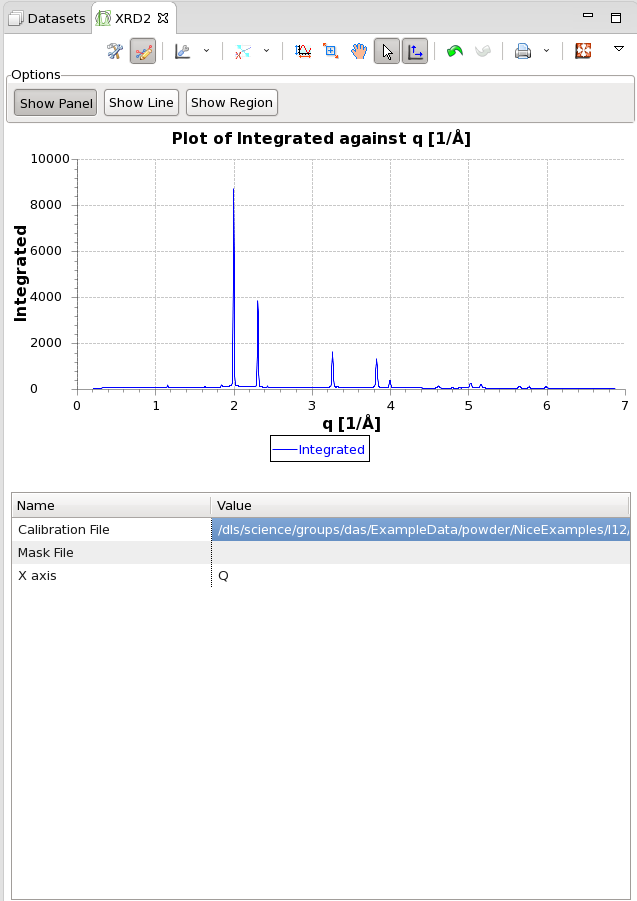
- The information panel can be hidden by clicking Show Panel, leaving just the plot of reduced data
- Clicking Show Line draws a line on the reduced data and a corresponding ring on the image
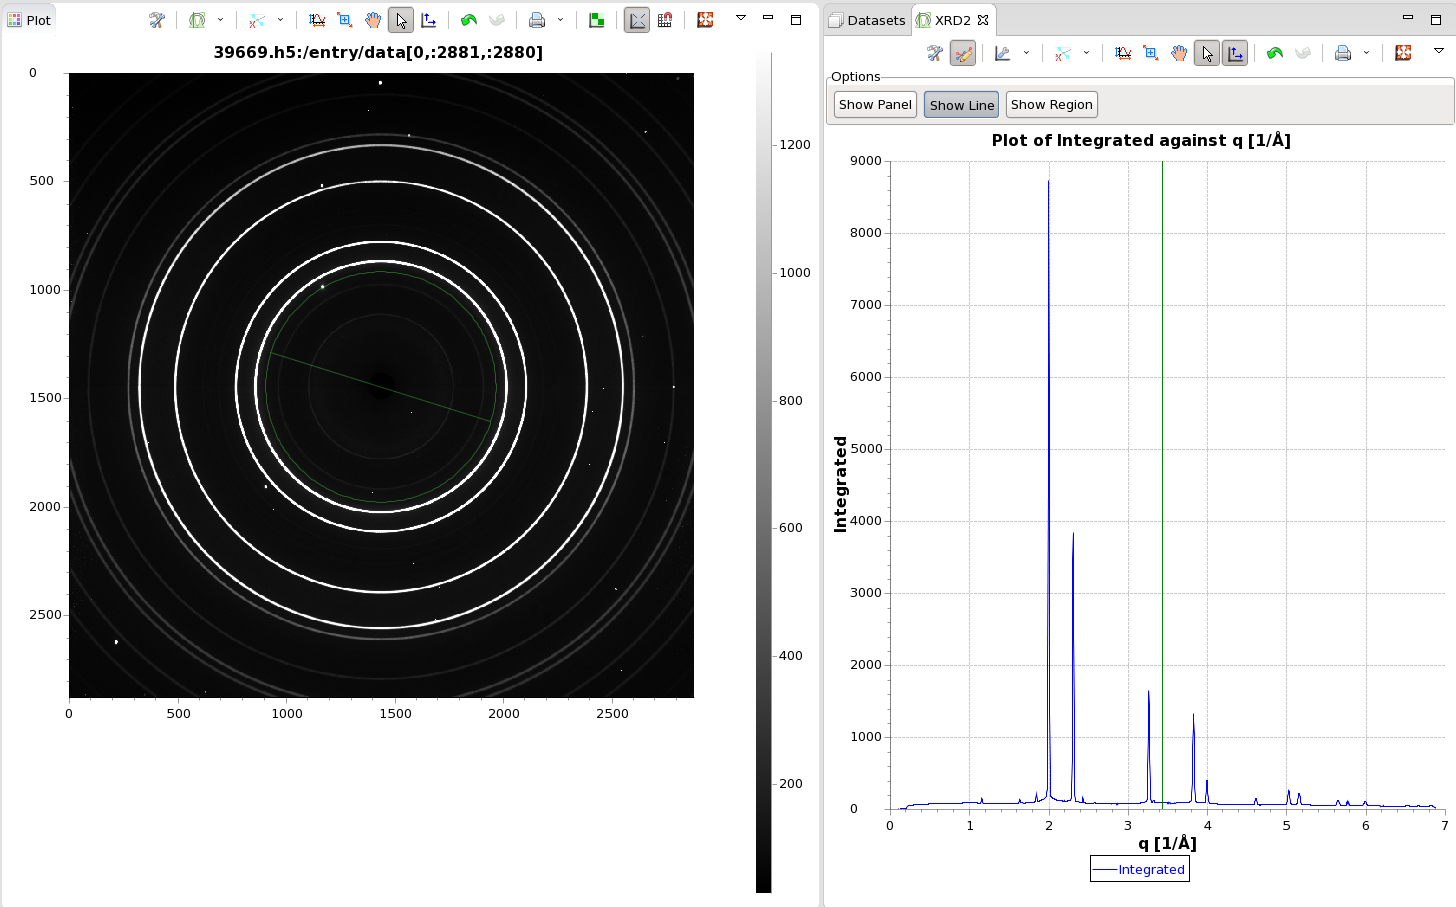
- The line can be dragged. Dragging the line will change the location of the ring
- Clicking Show Line again removes the line and the ring
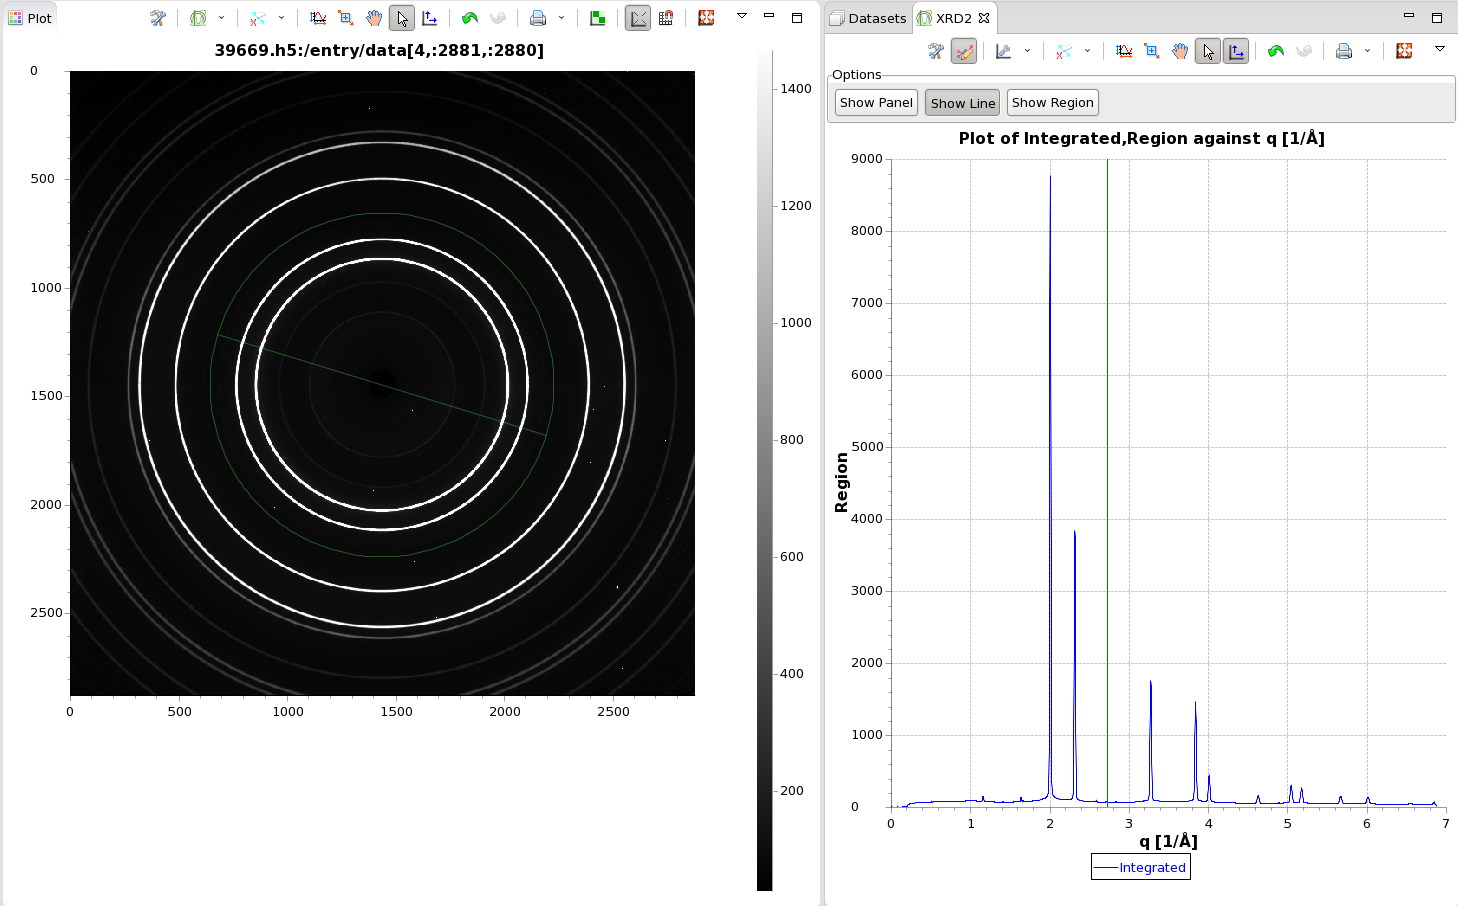
- Clicking Show Region draws a box on the raw image, and displays the integrated data from the box overlaid with the integrated data from the full image
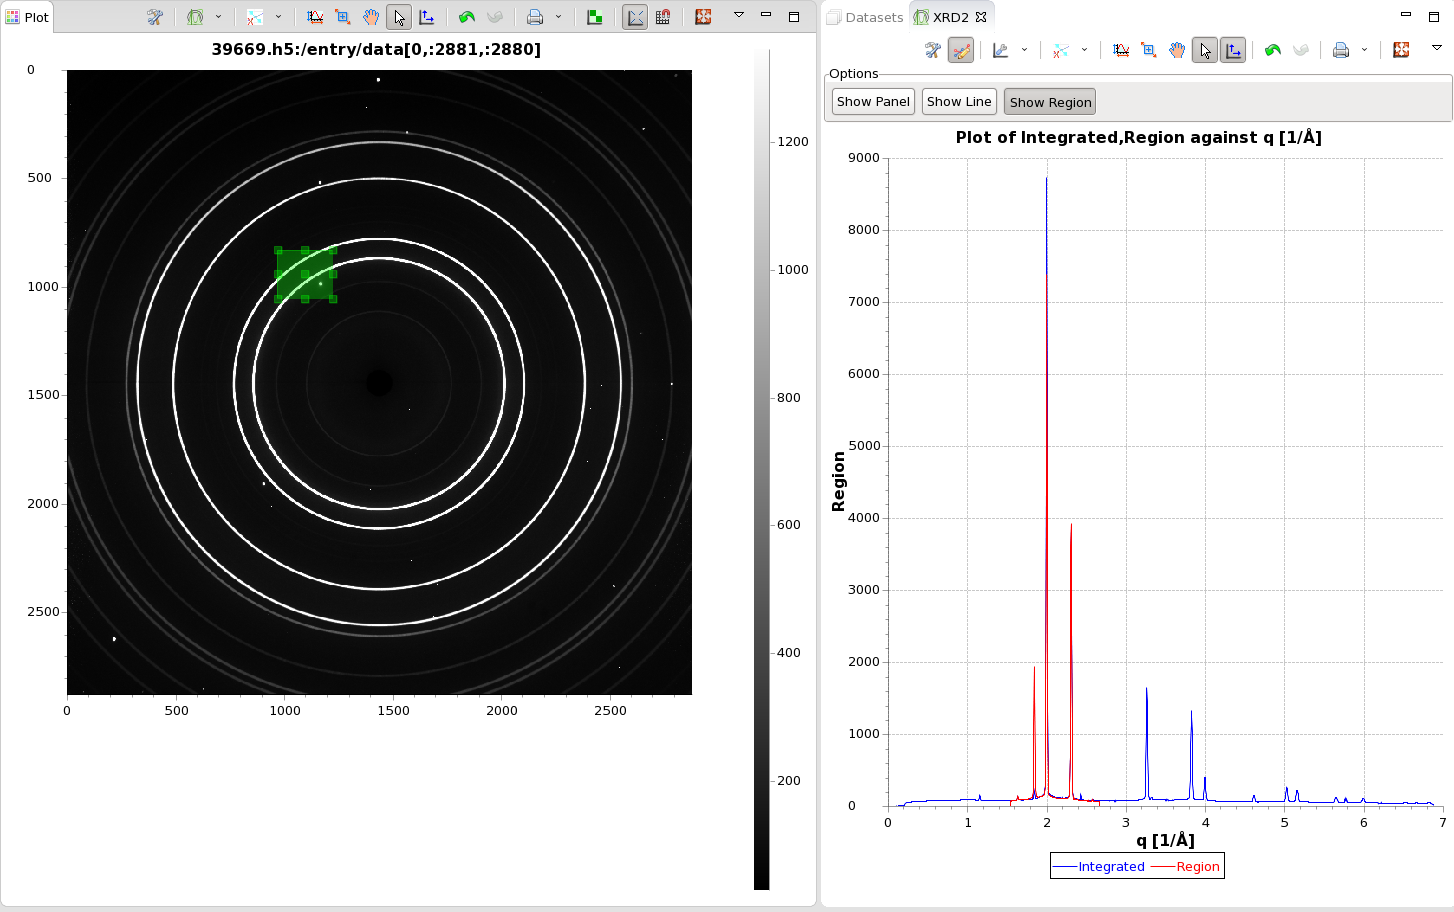
- Clicking Show Region again removes the region and its integrated data