/
XRD2
XRD2
- Jacob Filik
Owned by Jacob Filik
Last updated: Nov 07, 2017
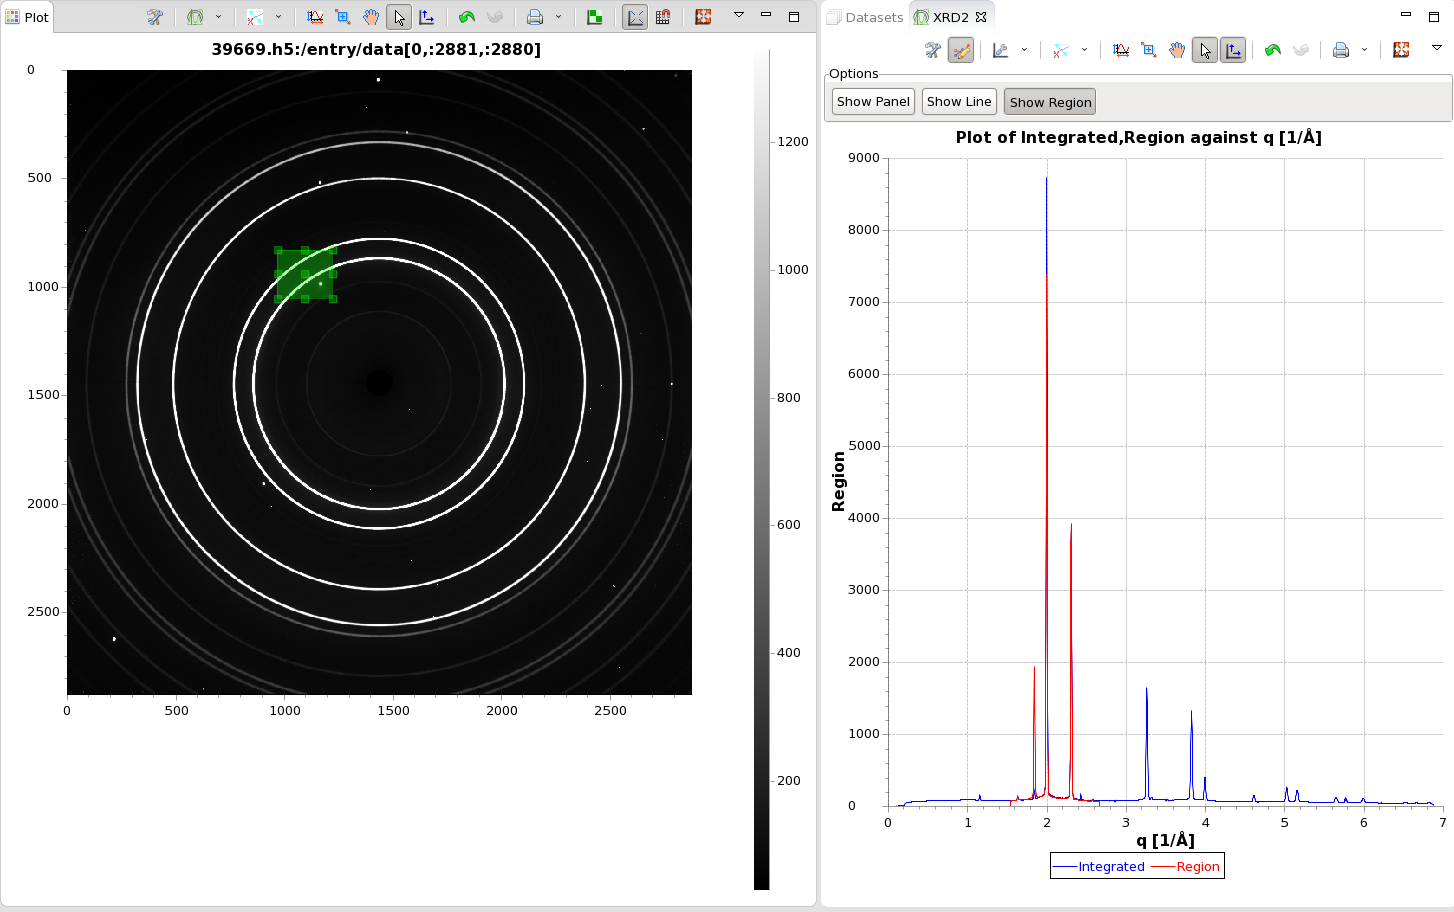
The XRD2 tool works on 2D diffraction/small angle scattering data, showing the reduced I vs q/tth/d data, and allows a line to be drawn on the reduced data and shows the corresponding ring on the raw data. A box can also be draw on the raw image data, allowing the integrated data from the box and full image to be overlaid.
Example
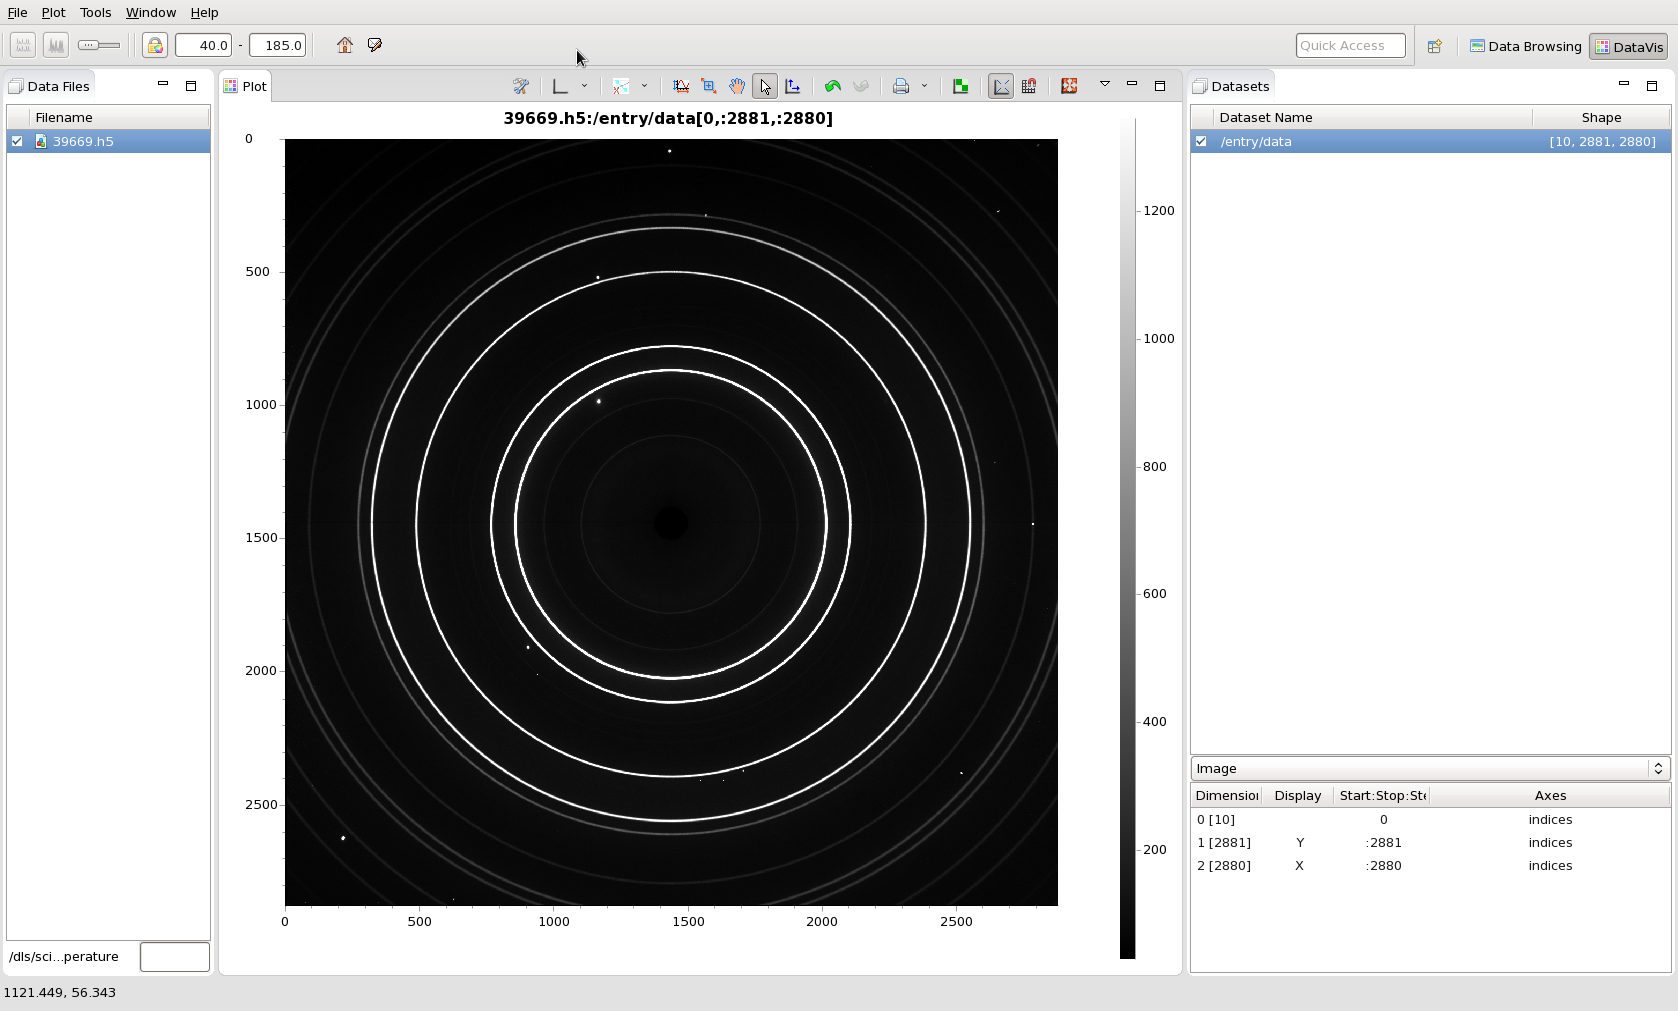
From a plot of a raw 2D image
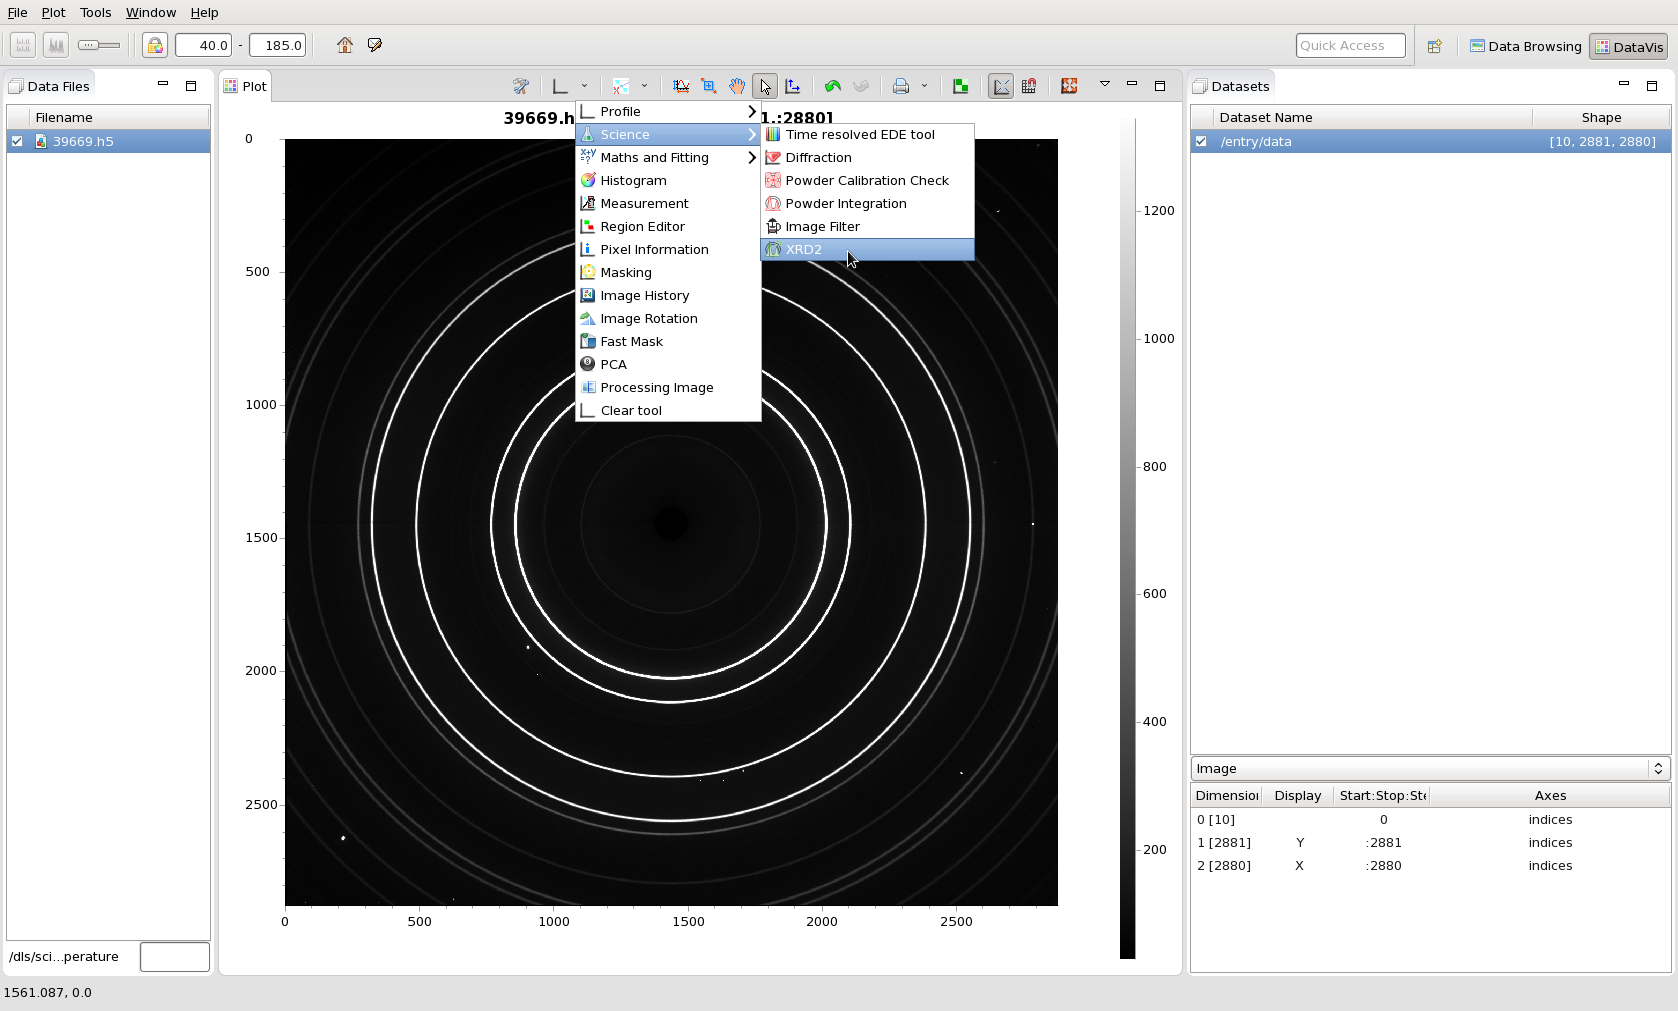
- From the tools menu, select Science/XRD2
- The tool contains three sections, an Options section, a plot and a panel for entering information (calibration/mask files etc)
- The first step is to load a calibration, the can be done by drag-dropping a file into the value column next to Calibration File, or clicking in the cell and using the buttons to open a file navigator
- Once a calibration file is selected, the reduced data will be shown in the plot
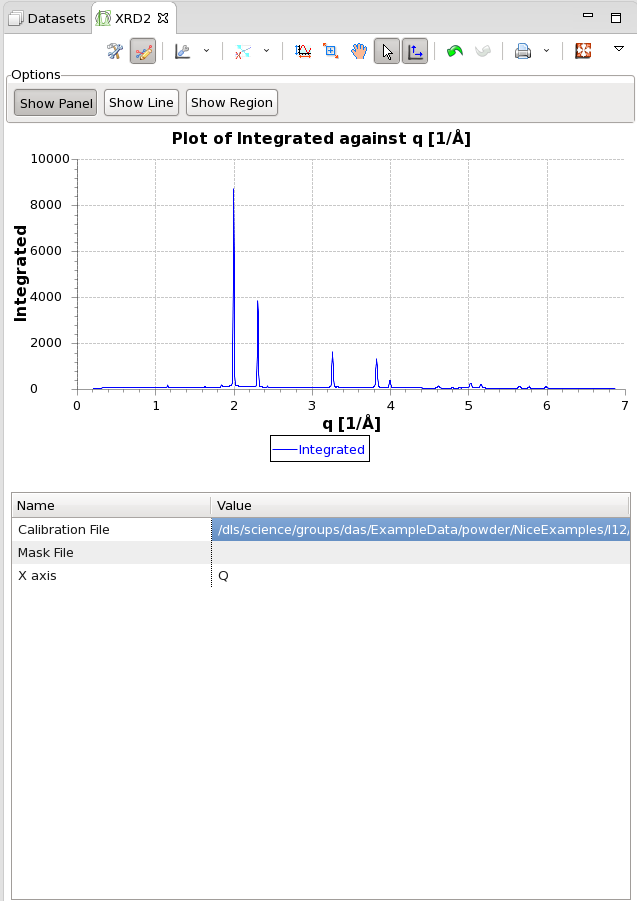
- The information panel can be hidden by clicking Show Panel, leaving just the plot of reduced data
- Clicking Show Line draws a line on the reduced data and a corresponding ring on the image
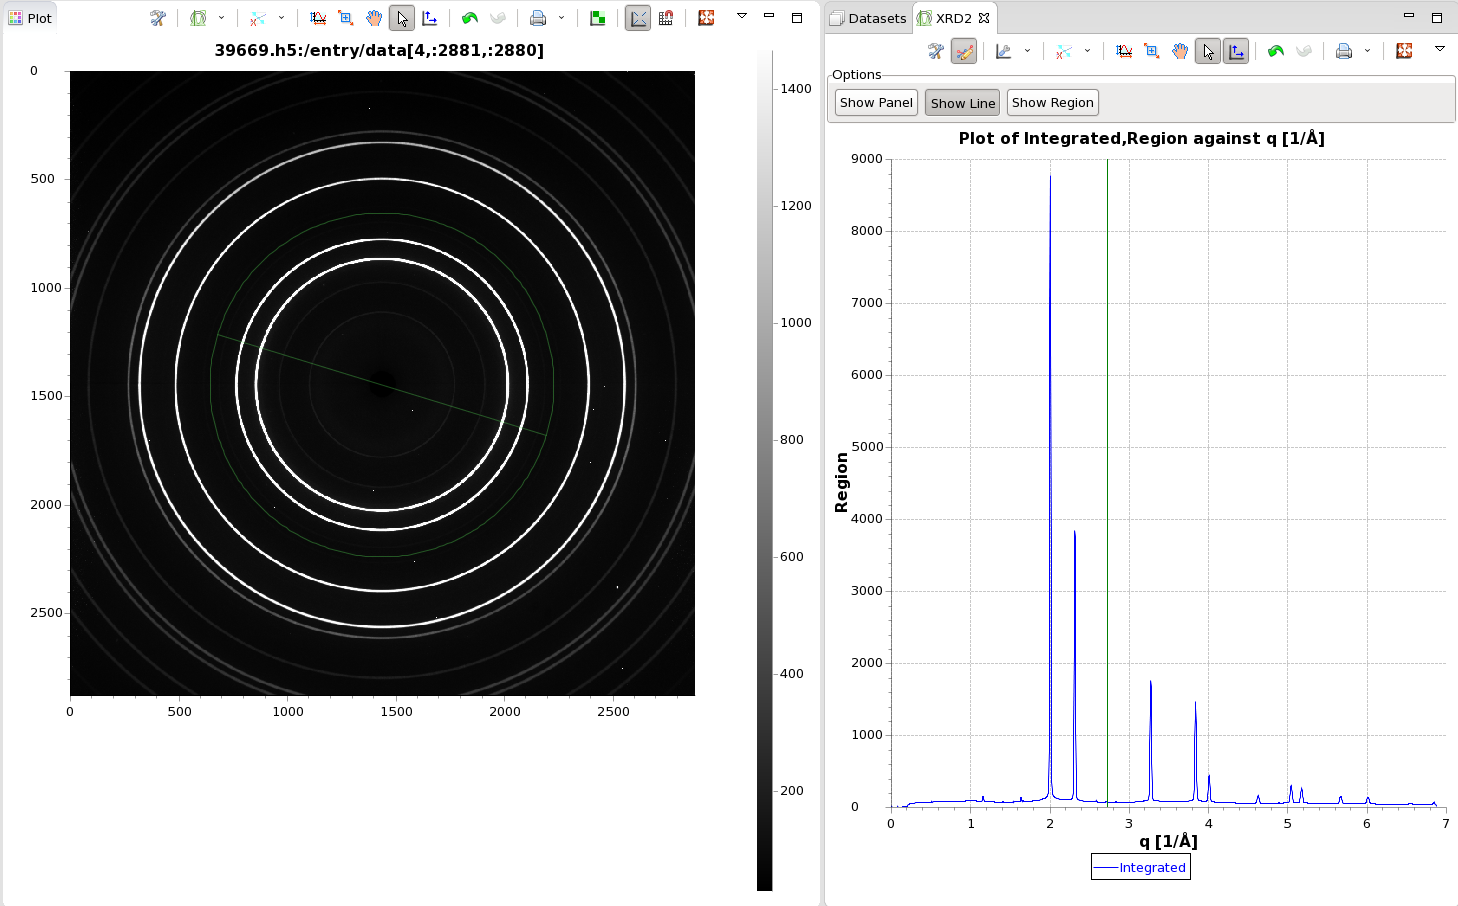
- The line can be dragged. Dragging the line will change the location of the ring
- Clicking Show Line again removes the line and the ring
- Clicking Show Region draws a box on the raw image, and displays the integrated data from the box overlaid with the integrated data from the full image
- Clicking Show Region again removes the region and its integrated data
, multiple selections available,
Related content
Introduction to TOPAS and jEdit
Introduction to TOPAS and jEdit
More like this
1. Introducing DIAD
1. Introducing DIAD
More like this
Processing your diffraction data
Processing your diffraction data
More like this
2. Instrumental Parameters - dQ, alpha & lor
2. Instrumental Parameters - dQ, alpha & lor
More like this