2D Powder Diffraction Data Reduction - Data Browsing Perspective and Powder Integration Tool [DAWN 1.6]
Video
Basic Image Integration - Single Image, Default Ranges, No Corrections
The data reduction process requires either valid experimental geometry to be in DAWNs default preference store (i.e. a suitable calibration was the last processed in the 2D Powder Diffraction Calibration perspective) or saved calibration parameters from a previous analysis. If you have neither of these things perform a calibration first by following the tutorials here.
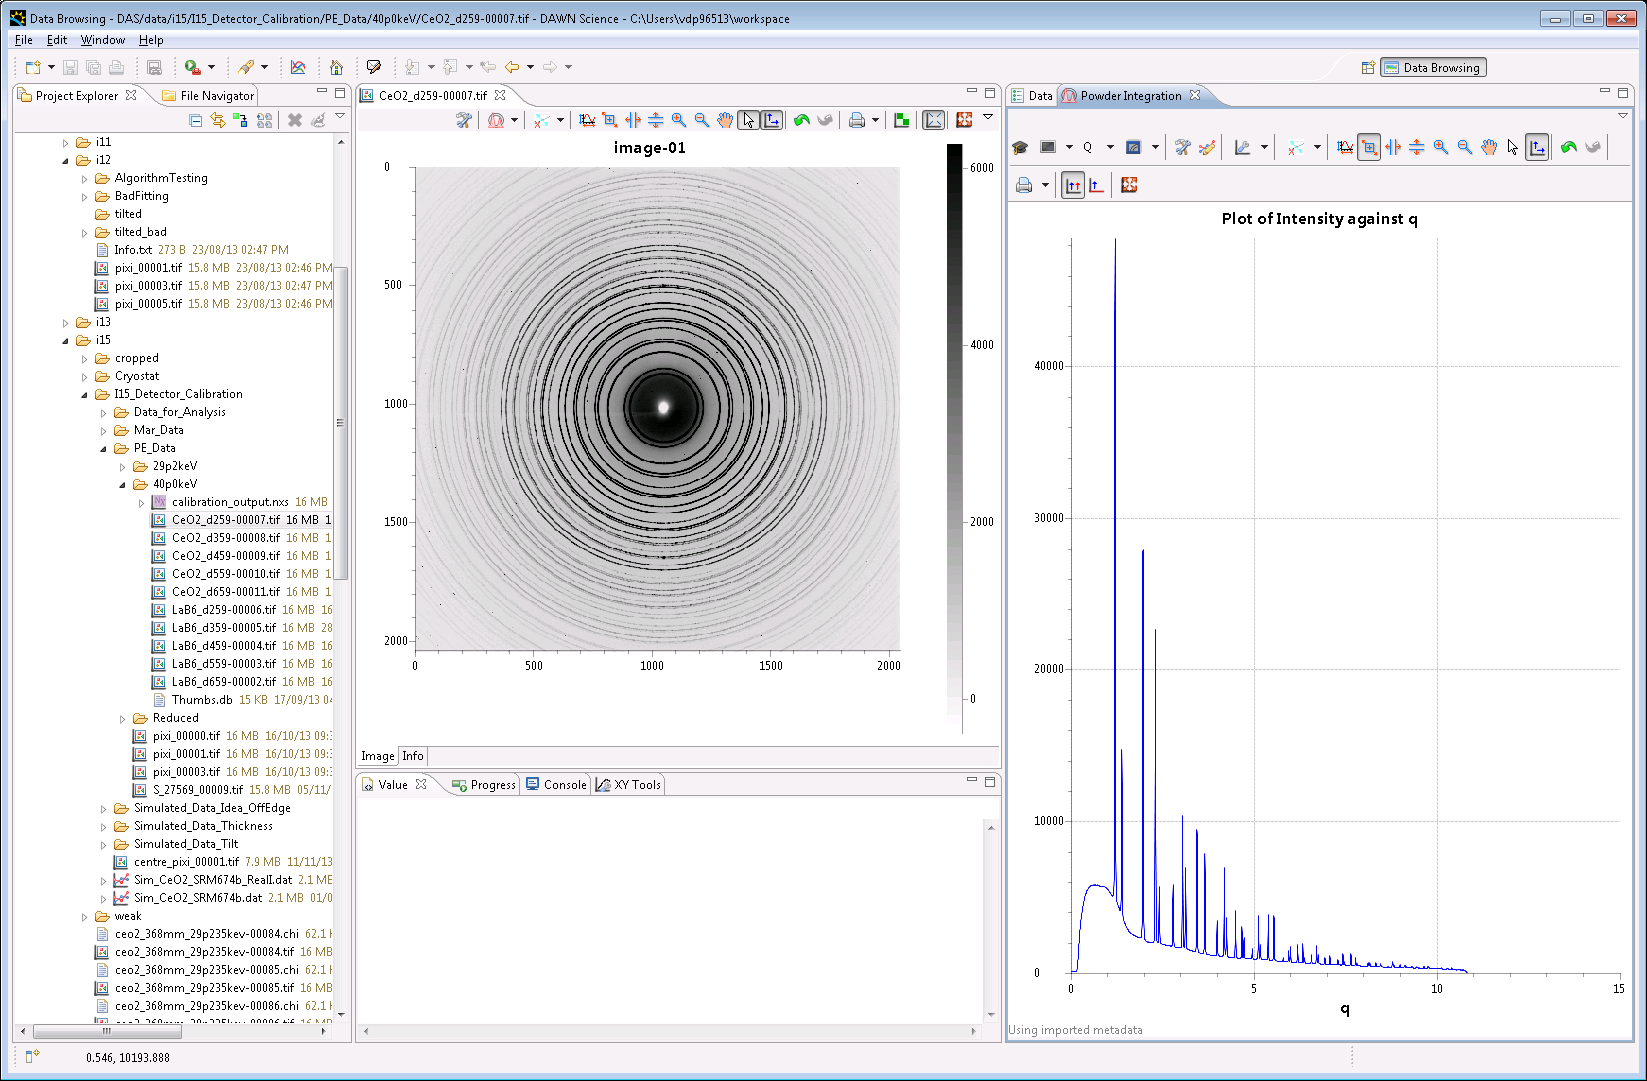
- Start DAWN and open the Data Browsing Perspective (generally the default perspective)
- Open the image you wish to reduce
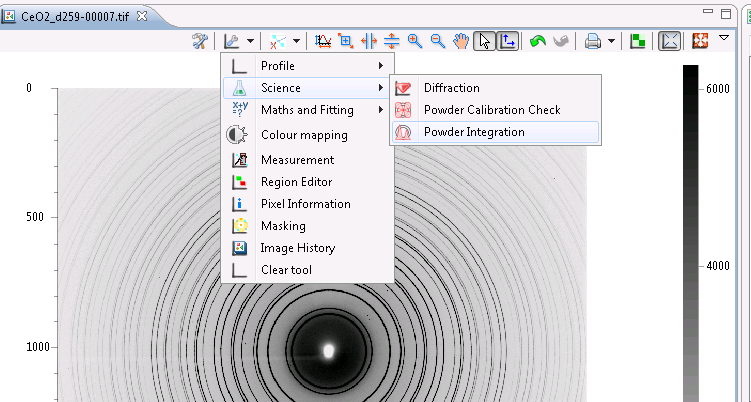
- From the plot tools menu select, Science - Powder Integration
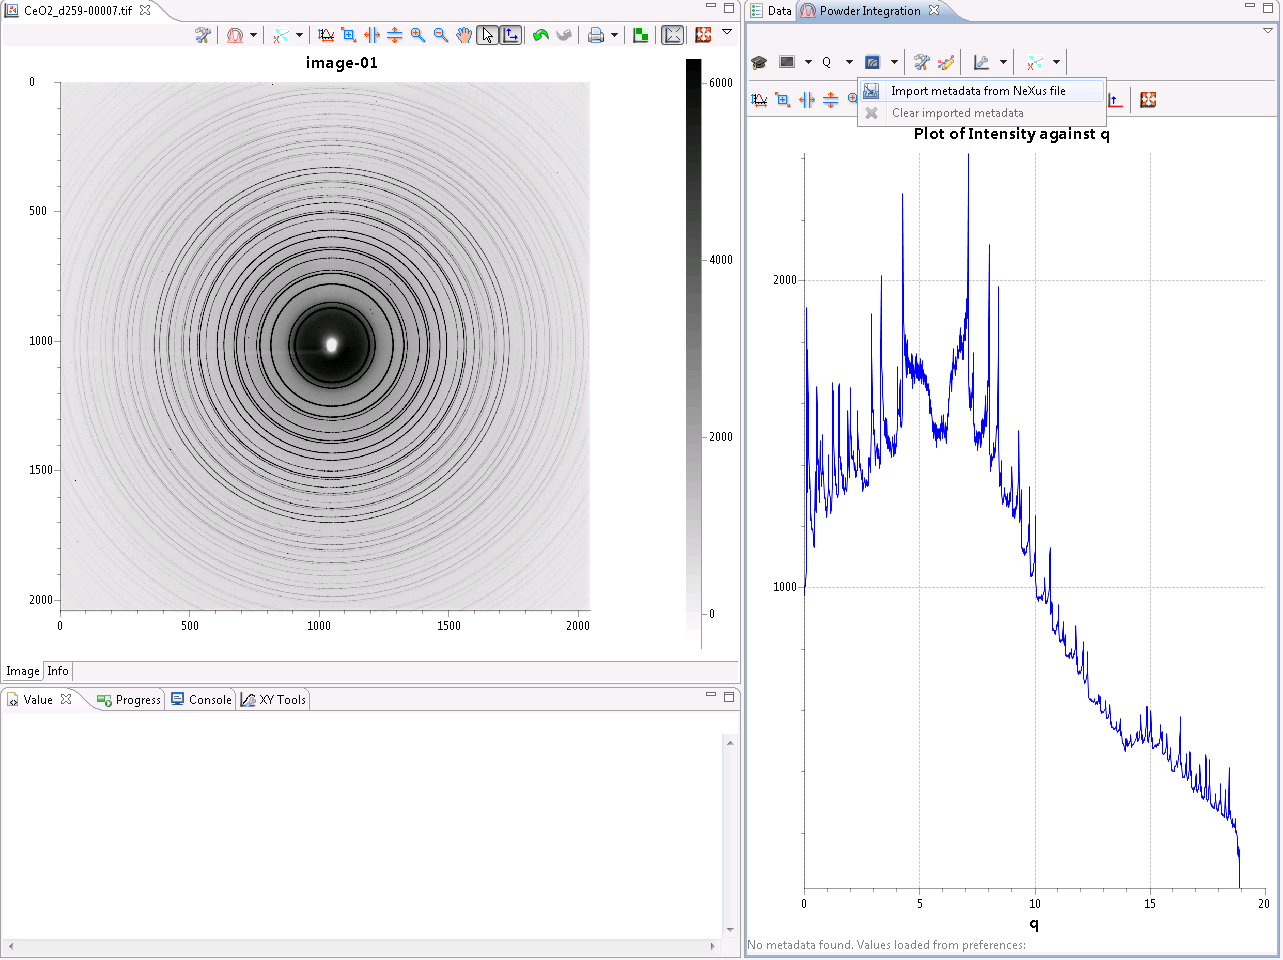
- The Powder Integration tool will appear showing the integrated image data, using the experimental geometry/energy metadata from the file or preference store
- In the image below incorrect metadata was loaded from the preferences producing a meaningless integration. To correct this metadata is loaded from a file that was saved from the Powder Calibration Perspective, using the Import metadata from NeXus file action.
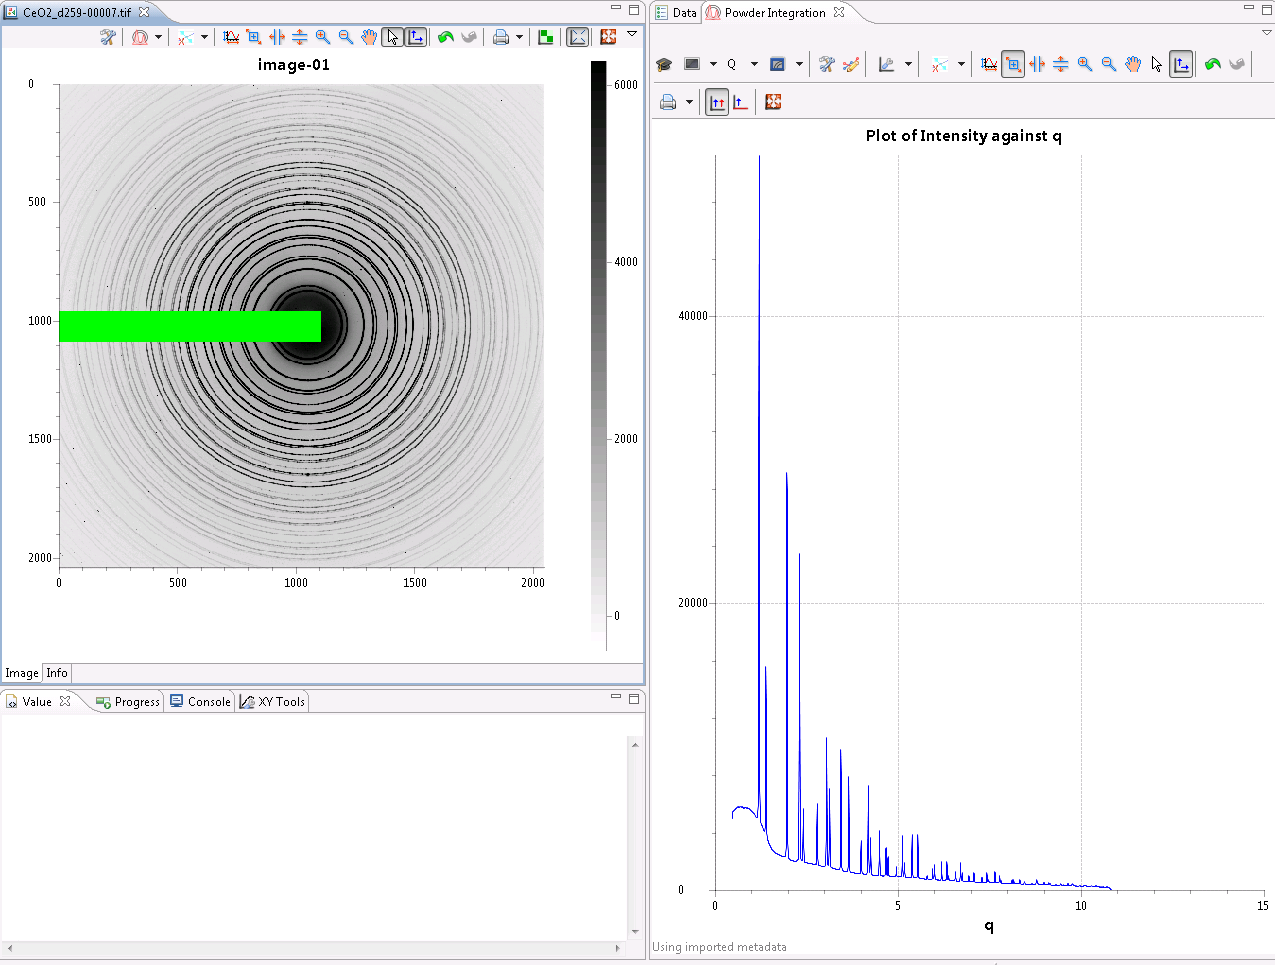
- With the correct metadata loaded a sensible 1D pattern is produced
- Using the actions in the tool bar, the integration axis can be changed (Q, 2 theta, d, pixel) and the integration method can be changed (non-pixel splitting, pixel splitting, 2D pixel splitting and 2D non pixel splitting, more information here)
- This reduced data can be saved to text using the Convert Plot Data to Tiff/Dat option (printer icon drop down arrow menu)
- NOTE: The Powder Integration Tool ignores masked areas so use the Mask Tool to remove any bad areas from an image (beam stop, hot pixels etc.)
Advanced Image Integration - Custom Ranges, Bin Sizes and Intensity Corrections
The default integration options in the Powder Integration Tool are fine for a quick look at the reduced data but it is usually necessary to specify the q or 2 theta range (and/or azimuthal range) as well as the number of bins used in the integration and what intensity corrections are applied.
- Again in the Data Browsing Perspective, open and image and then the Powder Integration Tool.
- Click the graduation cap icon to show the advanced integration options
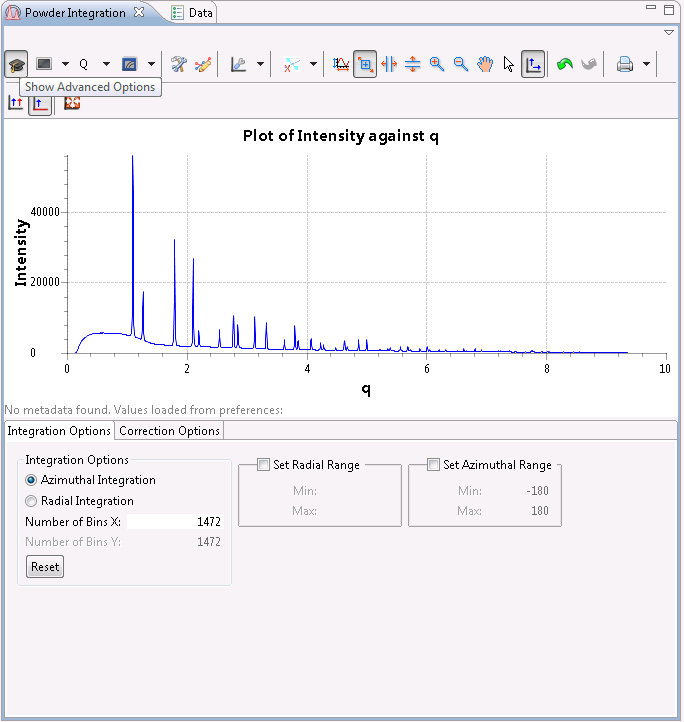
- The options in the advanced pane allow you to:
- Choose between azimuthal and radial integration
- Specify the number of bins the data is integrated into (default value is the max distance from the beam center to the edge of the detector in pixels)
- Set the radial and azimuthal ranges of the data to be integrated
- Decide whether to apply solid angle, polarization or detector transmission correction.
Advanced Image Integration - Process an Image/HDF5 Stack
Once you are happy with the Powder Integration Tool, its time to process multiple images. This tutorial requires a stack of images (images of the same size and experimental set up in a directory, or a HDF5 multiple image array, 3D or greater).
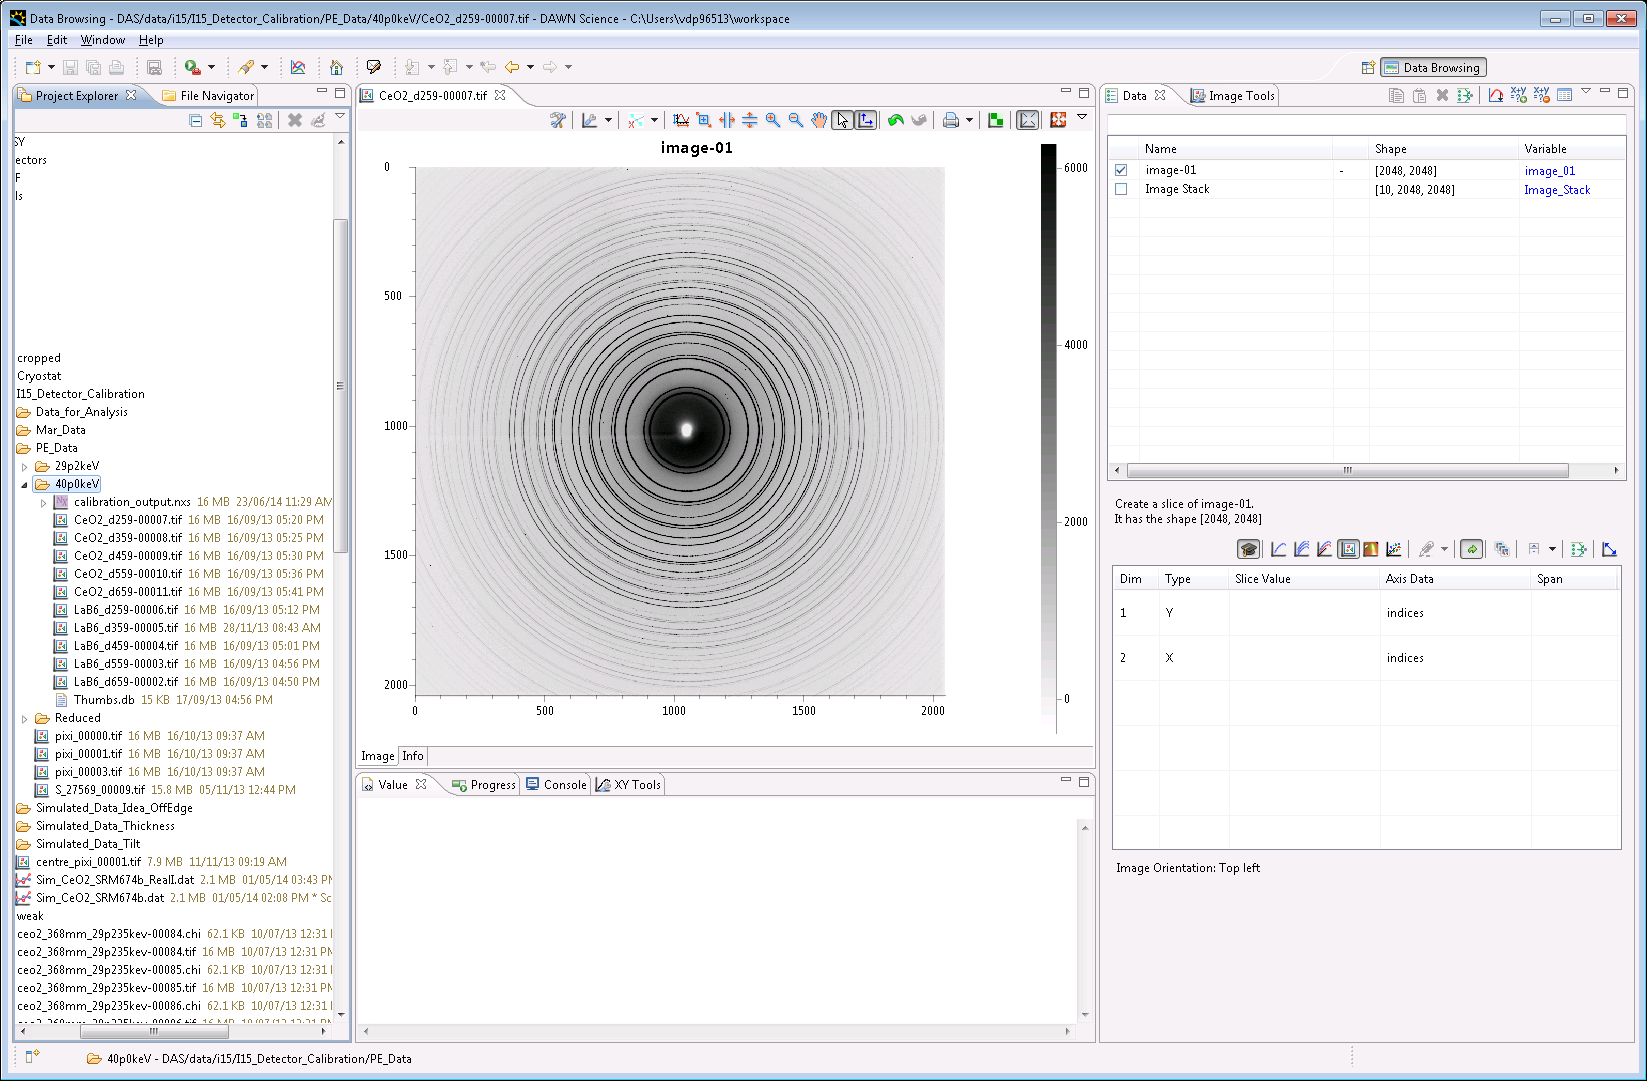
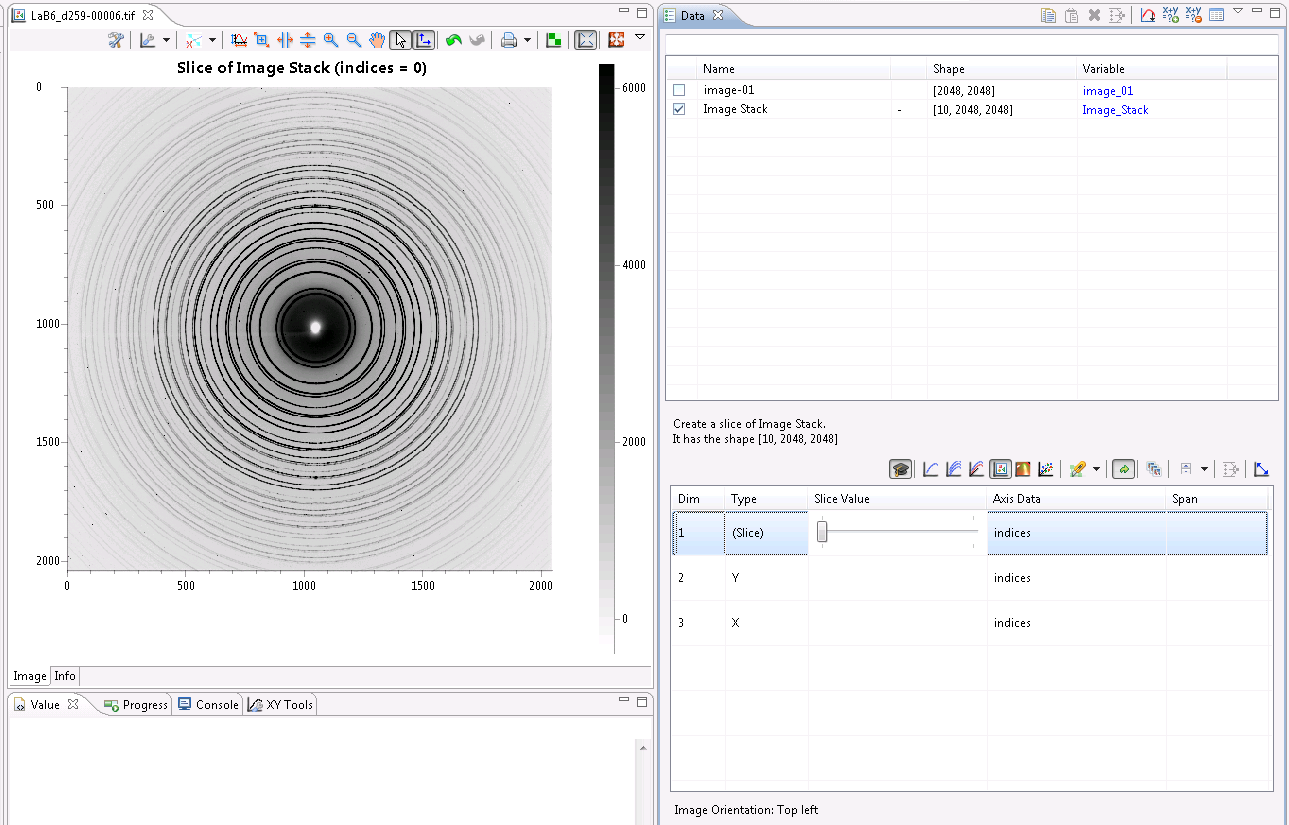
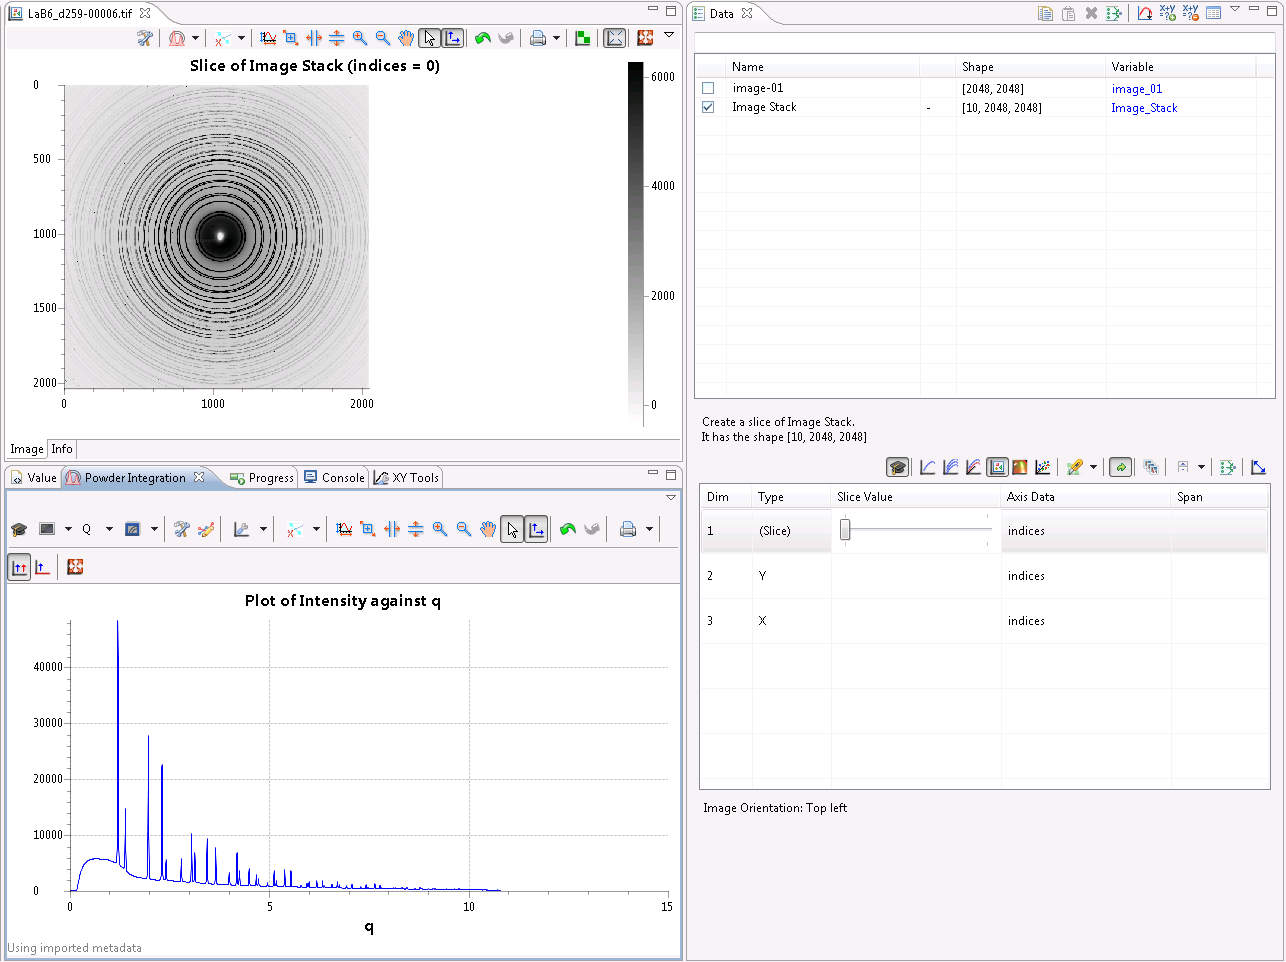
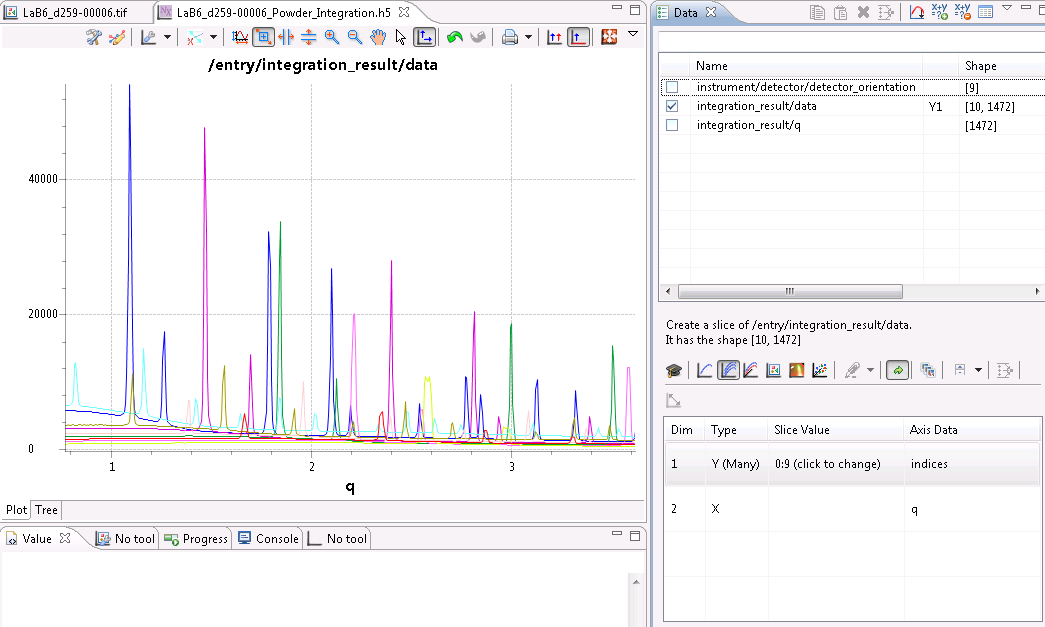
- Again in the Data Browsing Perspective, open one of the images in the directory, and in the Data view, select to show the Image Stack
- The slider that appears in the Data view slice options allows you to view all the images in the directory without having to open them
- Open the powder integration tool and drag it out of the way so both the tool and the Data view can be seen at the same time
- Notice how when you change position in the image stack using the slider, the Powder integration tool updates to show the reduced data for the displayed image
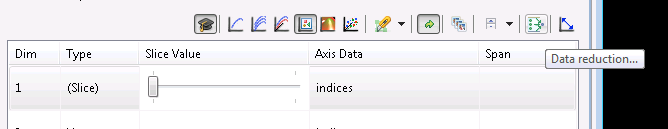
- Once you are happy with the axis type, integration algorithm, ranges and corrections, click the Data Reduction... option in the Data view to process all images in the directory.
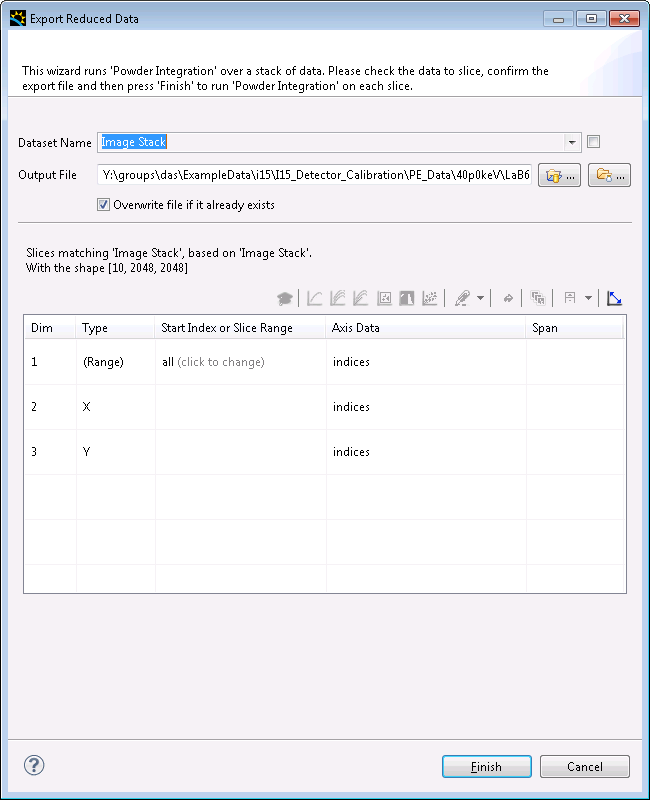
- The Export Reduced Data dialog will appear allowing you to select the location to save the reduced data to. Click Finish to reduce the data.
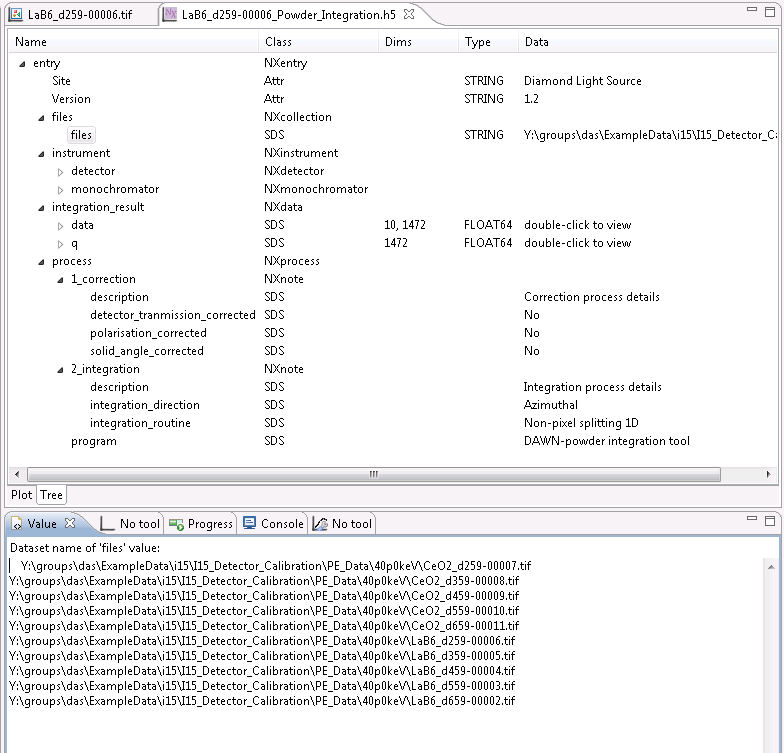
- The output NeXus/HDF5 file contains the reduced data as well as all the information about which algorithms and corrections were applied as well as the experiment geometry metadata.
- Although the NeXus file is a good container for all the information about the data reduction, is it often useful to be able to convert the reduced data to ascii for use in other data analysis programs.
- For this we use DAWNs data conversion wizard
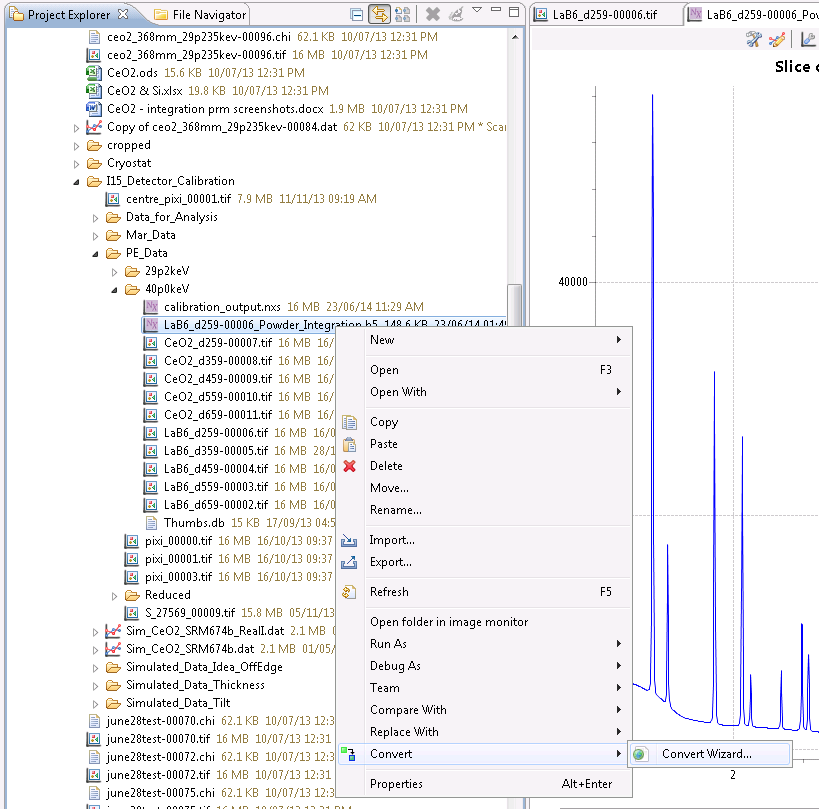
- Navigate to the reduced data file in the Project Explorer or File Navigator views, right click and select Convert -Convert Wizard...
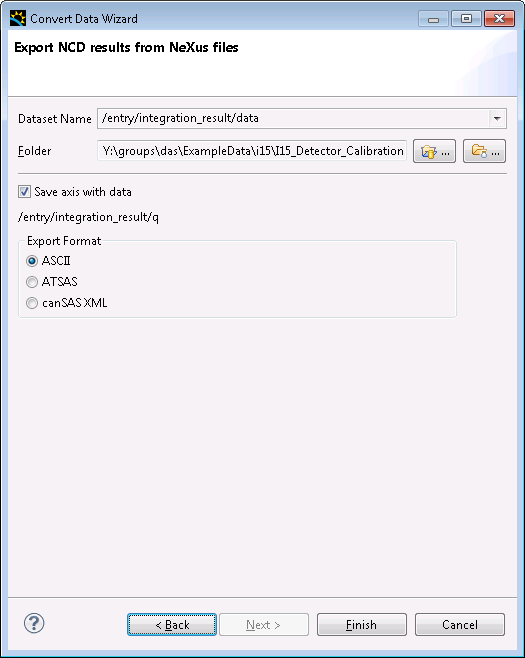
- In the wizard, under Conversion Type, select ascii from NCD data (NCD - noncrystalline diffraction, this conversion was designed for small angle scattering data but works fine here), and click Next >
- On the next page, check the dataset and axis are correct then choose either:
- ASCII - to save all the data in a single text file i.e. columns X, Y1, Y2, Y3...
- ATSAS - to save each 1D pattern in a single text file
- Once you have selected the required output format, click Finish, to convert the data
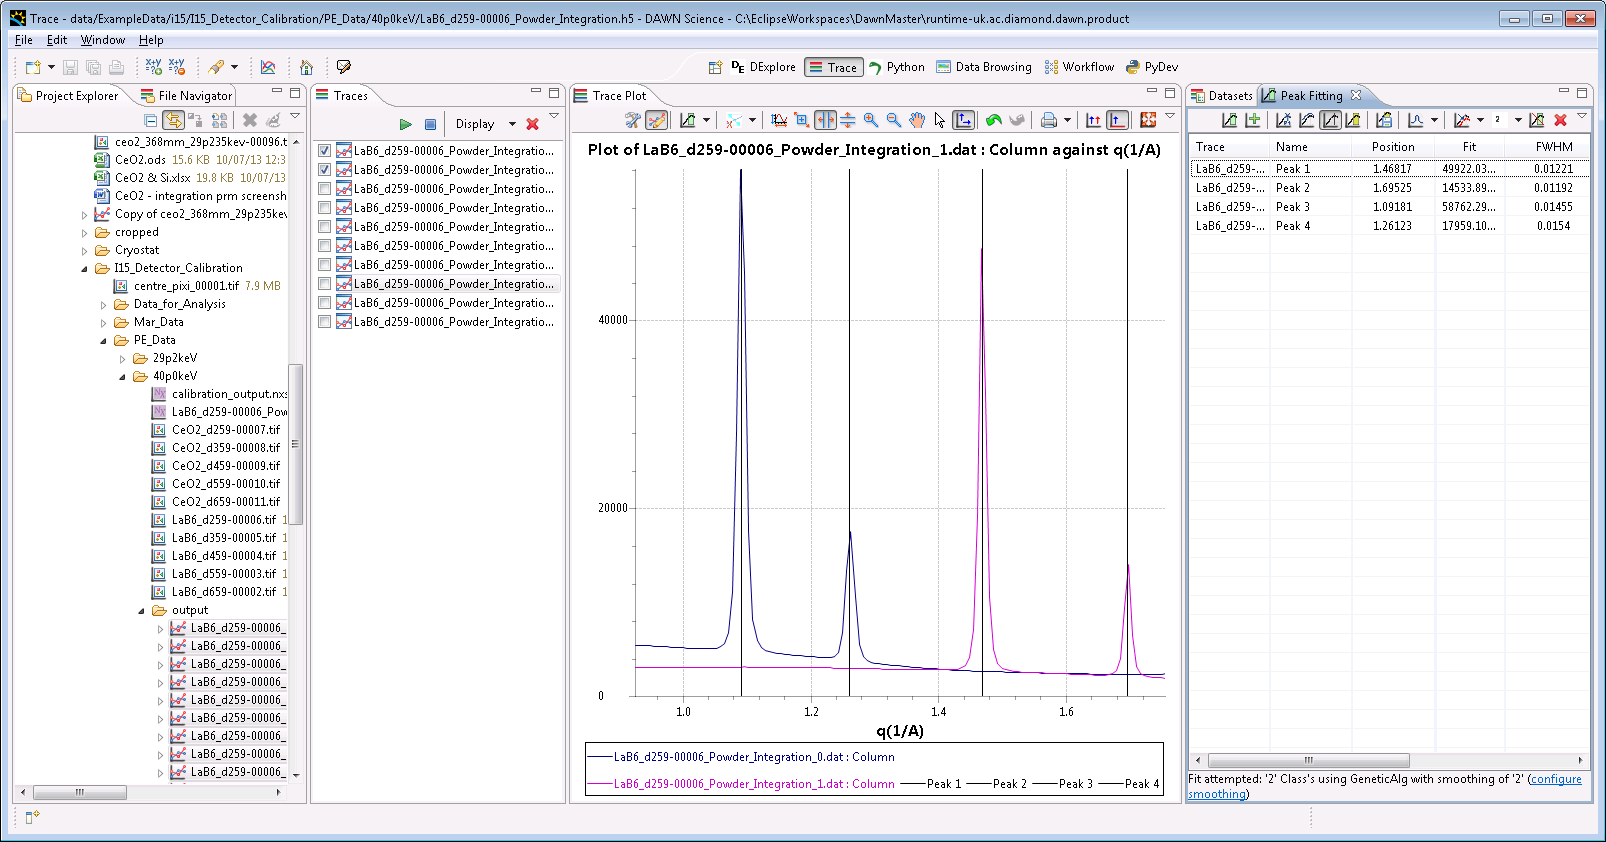
- The output ascii files can also be opened in DAWN for further analysis, i.e. shown here peak fitting in DAWNs Trace perspective