/
DataVis - Quick Line Plot Offset Widget
DataVis - Quick Line Plot Offset Widget
- Jacob Filik
Owned by Jacob Filik
Nov 14, 2017
Analytics
Loading data...
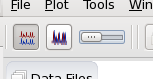
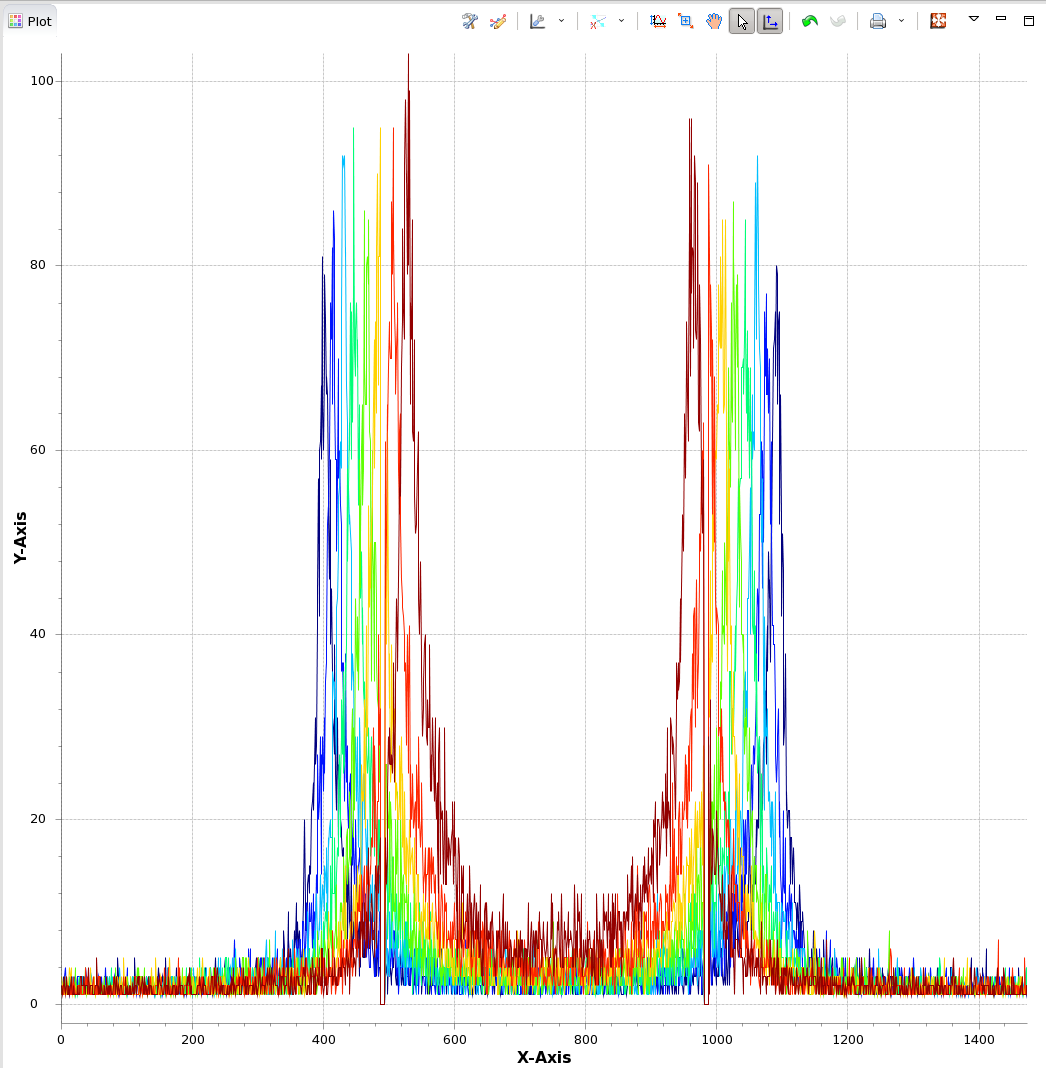
The Quick Line Plot Offset Widget becomes active when the DataVis plot is showing lines.
Clicking the first button activates stacking, the slider can be used to adjust the separation between the lines. The maximum separation is calculated from the data shown when stacking is activated (zooming in on weak signals makes the stacking ignore strong peaks).
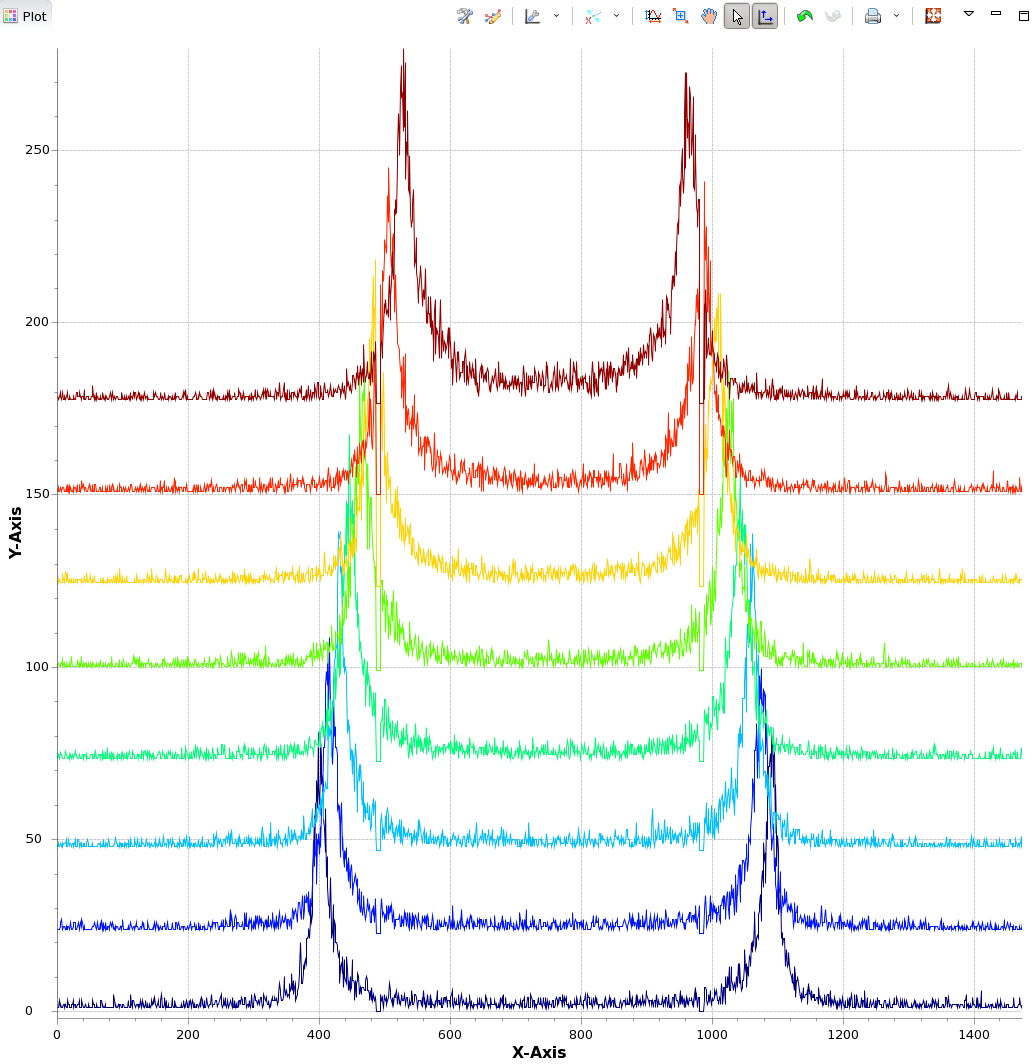
The second button causes the data to be normalised before being stacked, allowing strong and weak signals to be viewed at the same time.
, multiple selections available,
Related content
DataVis - Quick Histogram Widget
DataVis - Quick Histogram Widget
More like this
Session E. DAWN Training - Plotting Single Line Plots from Multiple Files [Trace Perspective]
Session E. DAWN Training - Plotting Single Line Plots from Multiple Files [Trace Perspective]
More like this
DataVis Perspective
DataVis Perspective
More like this
Visualisation and Fitting of an XRD Data Series from Text Files
Visualisation and Fitting of an XRD Data Series from Text Files
More like this
Min/Max/Sum
Min/Max/Sum
More like this
XRD2
XRD2
More like this