/
PCA Tool - Images of signal vs sample
PCA Tool - Images of signal vs sample
- Jacob Filik
- Matt Taylor (Unlicensed)
Owned by Jacob Filik
Last updated: Oct 30, 2019 by Matt Taylor (Unlicensed)
The PCA tool runs principal components analysis on an image composed of spectra/diffraction patterns of multiple samples.
Example
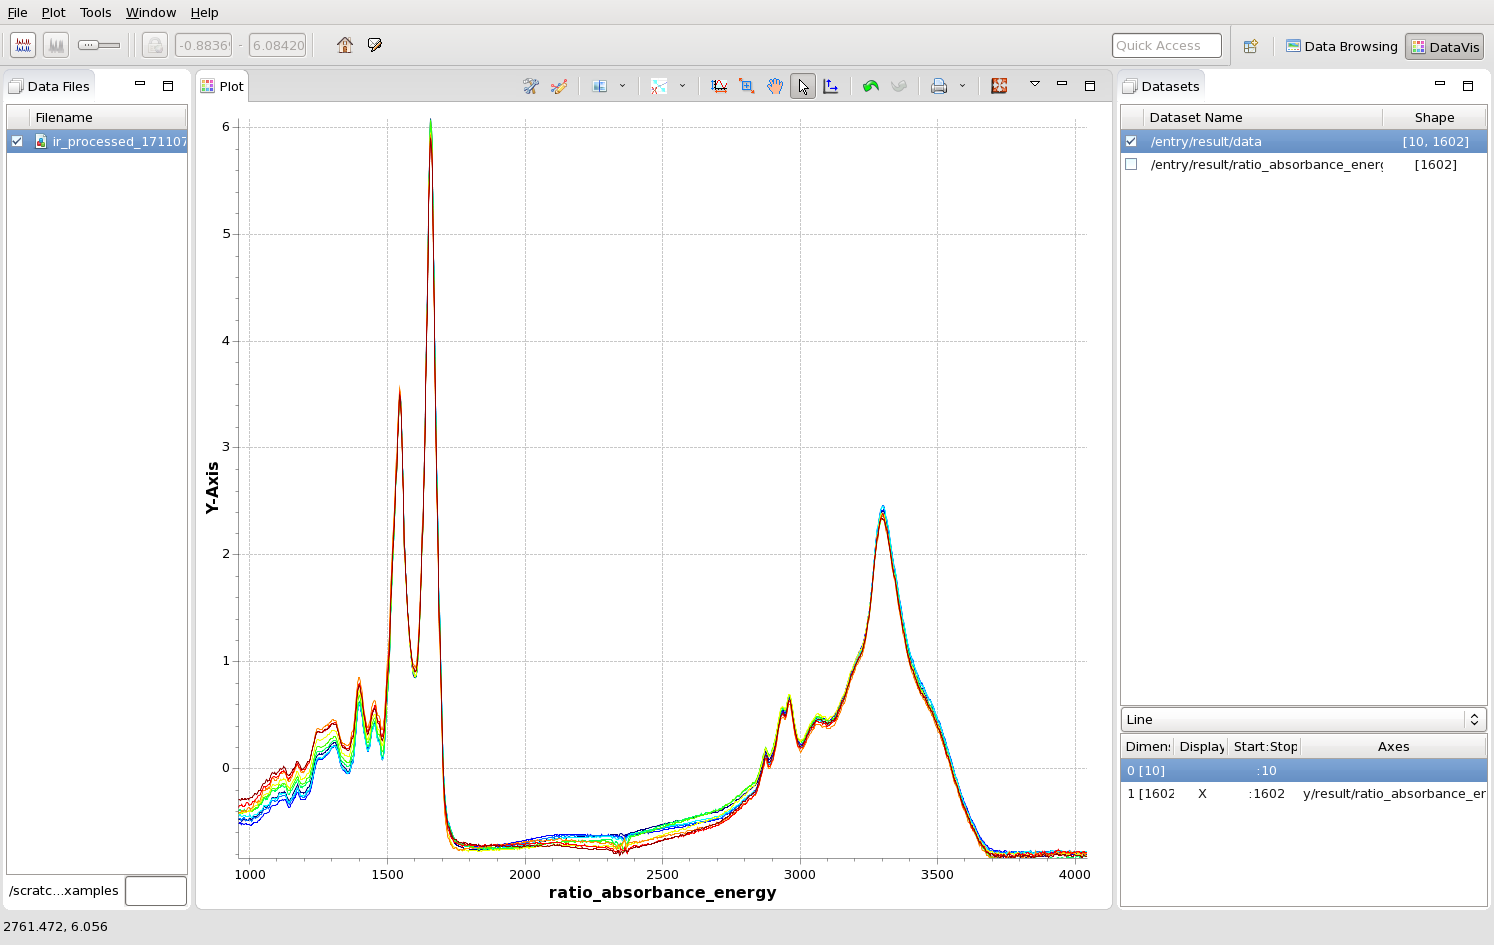
This file contains a sequence of 10 IR absorption spectra ([10,1602] data block), shown here as separate lines. To use the PCA tool to analyse the variance in this data set:
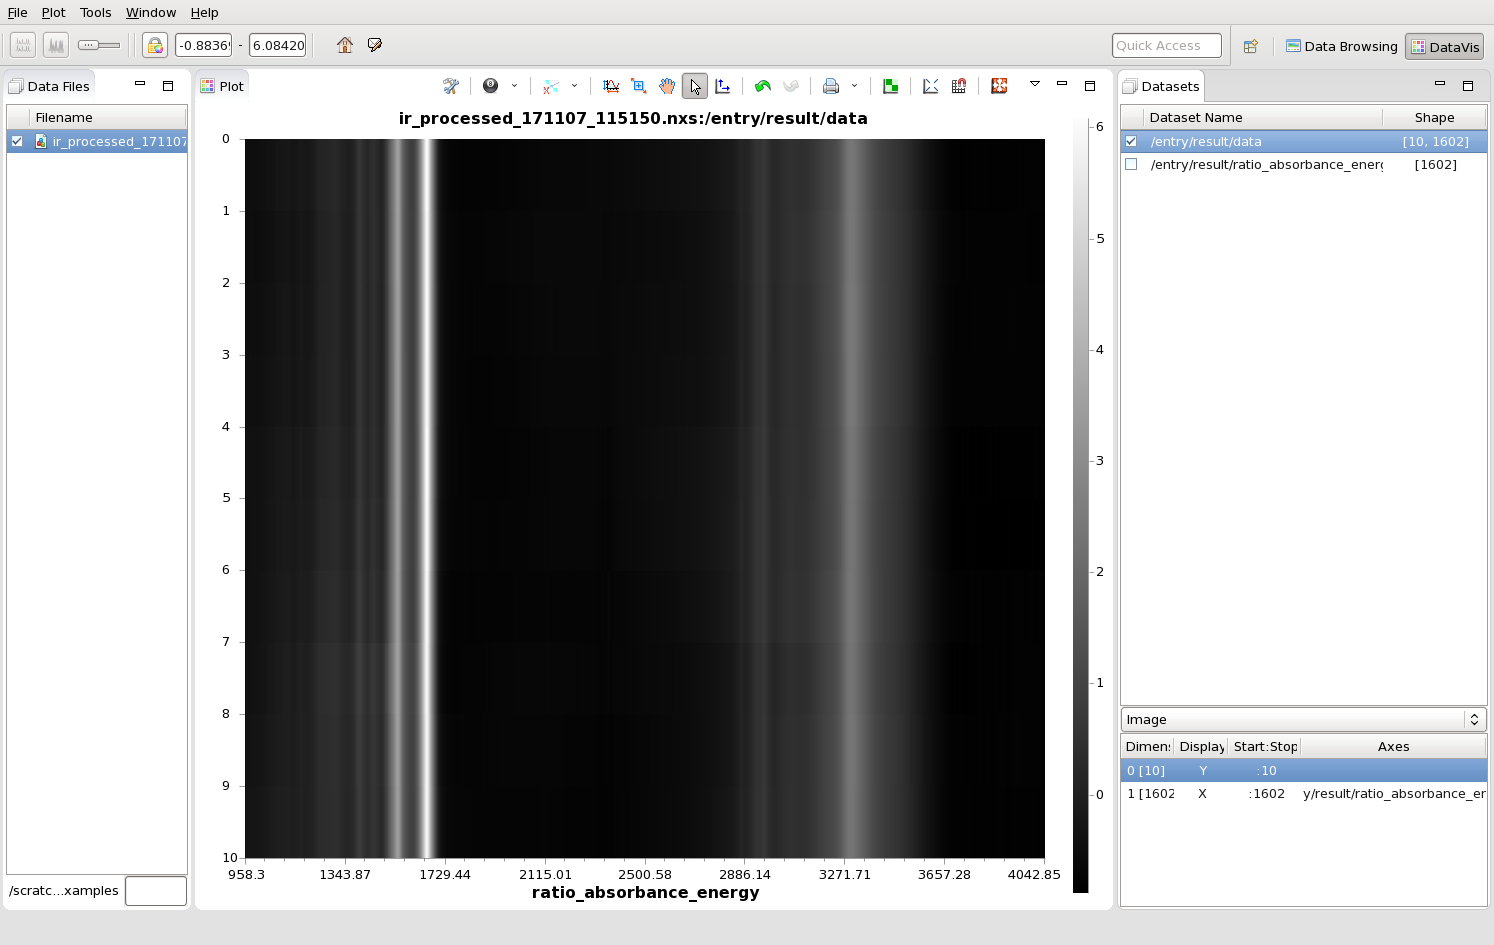
- Plot the data as an image,
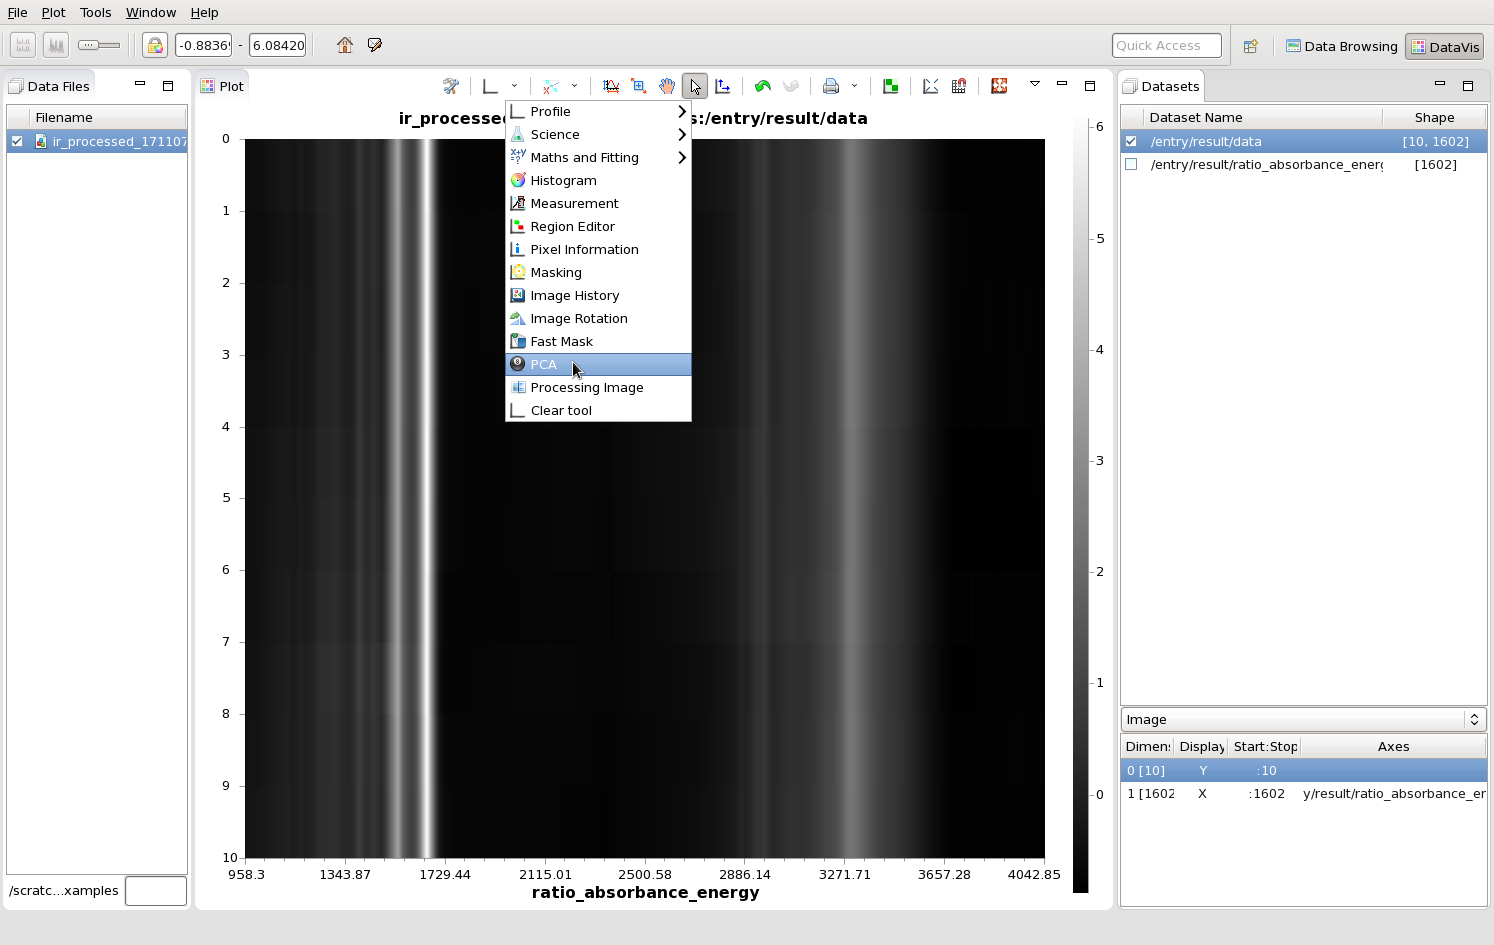
- From the tools menu, select PCA
- From the PCA View, Select the number of PCs to calculate and click Run PCA.
- When the calculation is complete, the % variance explained should be plotted against the component number in the Variance Explained tab
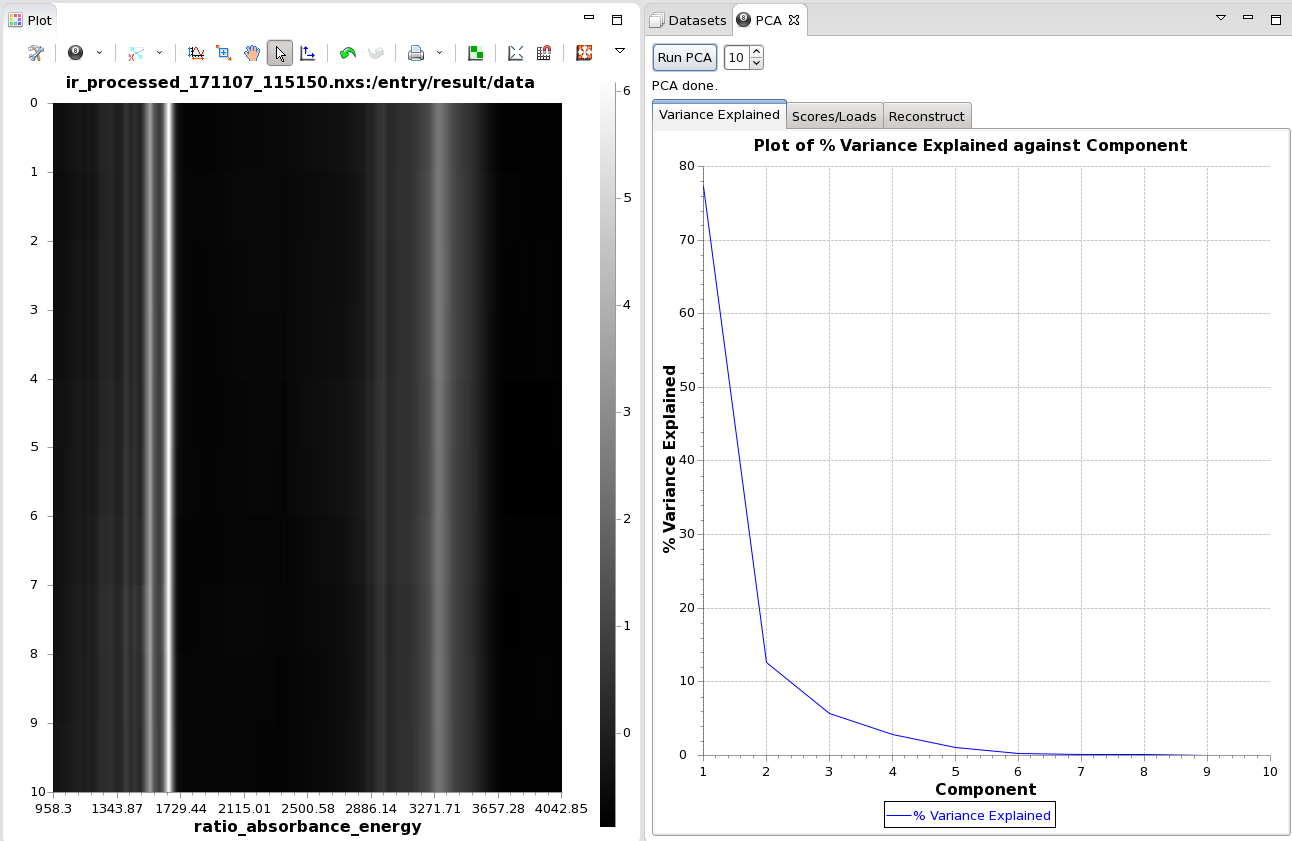
- There are other tabs with different ways to explore the PCA results
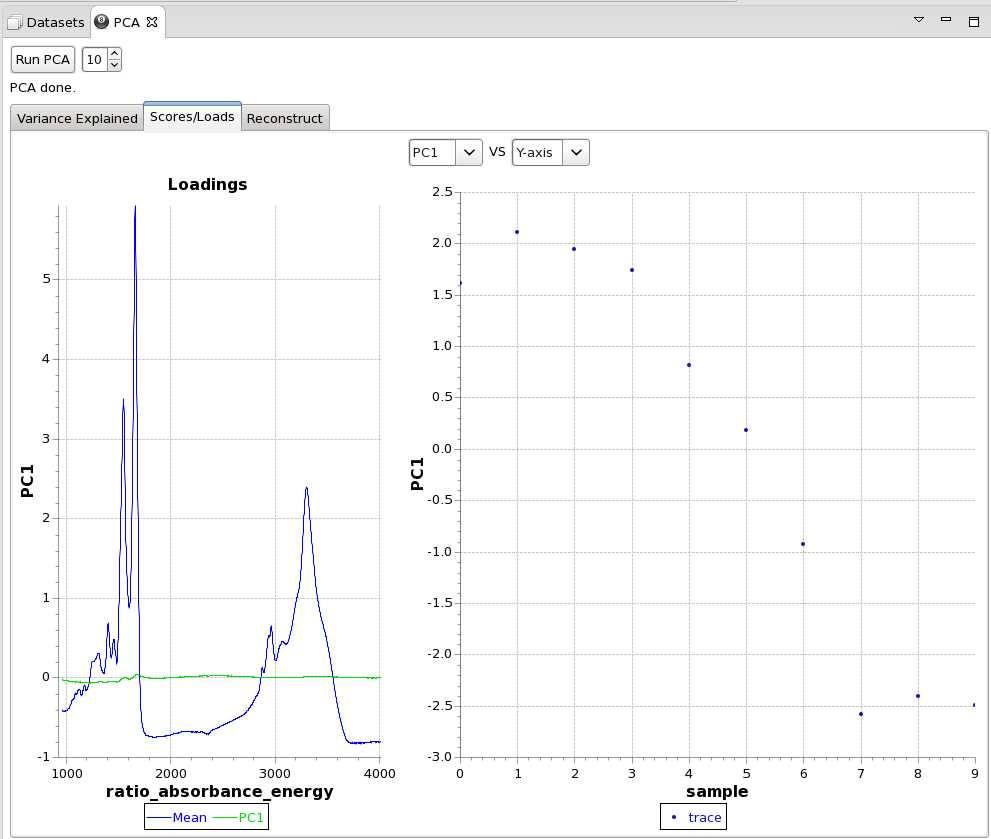
- The Scores/Loads tab allow the difference PC scores to plotted against each other (or the y-axis data of the image, which might be, for example, Temperature)
- The plot on the left shows the average spectrum/pattern plotted with the loadings vector for the selected PCs
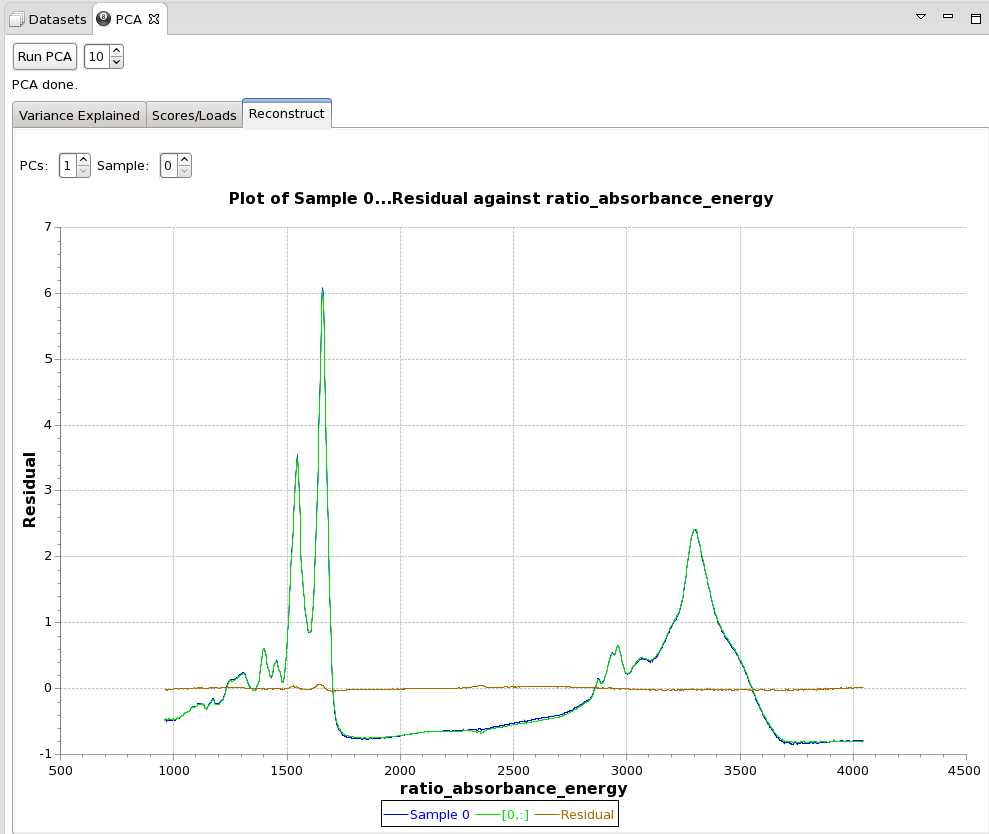
- The Reconstruct tab allows the data to be reconstructed using a limited number of PCs. This can be used to see how many components are needed to explain the variance in each sample.
- The number of PCs to use can be changed by adjusting the PCs spinner, the sample to investigate can be changed using the sample spinner
- The plot shows the sample data, the data constructed from the chosen PCs and the residual (sample - reconstruction)
, multiple selections available,
Related content
Processing your imaging data
Processing your imaging data
More like this
Processing your diffraction data
Processing your diffraction data
More like this
DIAD Data Structure
DIAD Data Structure
More like this
Introduction to TOPAS and jEdit
Introduction to TOPAS and jEdit
More like this